
Businesses choose Oracle E-Business Suite because it can be adapted to their own processes with custom code. Most of them then struggle with performance, and the cause is nearly always inefficient custom code: a few dozen statements use most of the database CPU. Finding and correcting them used to take an expert weeks per system. With AI, it is done in an afternoon and ends with the corrected code.
This post shows three examples from large EBS systems, explains the Blitz Reports the review is built on and what each of them typically shows, and describes how to run such a review yourself.
2. What the CPU costs
3. The method
4. Top SQL: where the CPU goes
5. Memory: the SGA is usually too small
6. Parameters and maintenance jobs
7. Literal SQL
8. Getting the source code
9. The AI skill
10. The result
11. Run it yourself, or send us the outputs
1. Three examples
Three recent examples show what such a review finds. They are large manufacturers running Oracle EBS on Exadata, with two RAC nodes of 28 to 90 CPUs each. Each review used Blitz Report only, without a database or server login.
All figures are from one week of AWR data. Load is given in average active sessions: the number of sessions working at any moment, averaged over the week. One average active session on CPU is one CPU busy around the clock.
The first system ran with 17 average active sessions on CPU. One custom program that creates move orders used 15% of that, 2.5 sessions. It looked up the source subinventory up to four times per line, 15 million executions per week at 20,700 buffer gets each, which alone kept 2.1 sessions busy. Inside a nested loop it also ran six select ... from dual statements 4.9 billion times per week, 8,000 per second. Another 10%, 1.7 sessions, went to a check in the AutoInvoice preprocessing that ran 2.95 million times per week at 84,000 buffer gets and did not return a row once. The review removes 85.3% of the database CPU load, 14.7 of the 17 sessions: 64.4% through code corrections in 13 programs and 20.9% through configuration changes, such as database administration and program setups.
The second system ran with 16.5 average active sessions on CPU, on 80 CPUs. Only 74% of its database time was on CPU. The rest was waiting, mostly for disk reads (15%) and for blocks from the other RAC node (7%): of 708 GB of memory per node, 300 GB were assigned to the SGA, and more than half of that was shared pool, grown to hold 126,000 duplicate cursors, which left a buffer cache of 142 GB for a database of 10 TB. A larger SGA removes nearly all of that waiting. On the CPU side, the main finding was not a slow query: 40.3% of the database CPU, 6.7 sessions, was spent re-checking things that had not changed. The same bills of material were exploded again and again, static setup data was read once per line, interface tables with no new work were scanned in full, the data dictionary was asked the same question 11,288 times a week at up to 1.9 million buffer gets, and one program polled without a pause. Most of it is removed with a date restriction, a cached lookup, a purge program or a sleep interval. The review removes 68.8% of the database CPU load, 11.3 sessions: 45.7% through code corrections in 17 packages and 23.0% through configuration changes, such as database administration and program setups.
The third system ran with 12 average active sessions on CPU. The review removes 80.9% of the database CPU load, 9.5 sessions: 21.4% through code corrections and 59.5% through configuration changes, such as database administration, program setups and schedules.
The percentages are the corrected statements’ share of the database CPU, measured in AWR over a week. A lookup that ran 15 million times a week and runs once per request afterwards loses nearly all of its cost.
2. What the CPU costs
On Exadata Cloud Service and Exadata Cloud@Customer, CPU is paid for per enabled OCPU and can be scaled online. Load that is no longer there can therefore be turned directly into fewer enabled OCPUs: the 14.7 average active sessions of the first system are as many CPUs busy around the clock. For systems of this size that is a large yearly amount. On owned hardware the saving is deferred: the next capacity upgrade moves out, batch windows shrink, and month-end no longer competes with interfaces for CPU.
The users notice it as well. The programs that burn the CPU are the ones that keep interfaces behind and make reports and forms slow at peak times.
3. The method
The review needs no access to the EBS database. Everything comes from Blitz Reports that a DBA or administrator runs on production and saves as Excel files:
| Question | Report |
| Which statements use the CPU? | DBA AWR SQL Performance Summary |
| How much of the memory is used, and how much time goes into disk reads? | DBA SGA+PGA Memory Configuration |
| Are the database parameters right for EBS? | DBA Database Parameter Validation |
| Which database jobs run that EBS does not need? | DBA Automated Maintenance Tasks |
| What is the database waiting for? | DBA AWR Wait Event Summary |
| Which statements are built with literals? | DBA SGA SQL Performance Summary |
| What does the code behind them look like? | DBA Text Search, DBA Objects, Blitz Report Custom Reports Converter |
The AI reads the outputs, traces each expensive statement to the package and line it comes from, corrects the code and writes the review. The following sections go through the reports.
4. Top SQL: where the CPU goes
DBA AWR SQL Performance Summary lists the statements of the AWR window, by default the last week, with their share of the total database CPU, their CPU and elapsed time, executions, buffer gets per execution, the module, and the PL/SQL package and line that executed them. That last column is what makes the review possible: it leads from a sql_id straight to the code.
 Example output of DBA AWR SQL Performance Summary (Excel)
An excerpt of the kind of rows that matter (from the first example above, names changed):
| Code | Executions per week | Buffer gets per execution | Average active sessions on CPU | Finding |
| Custom move order package | 15,000,000 | 20,700 | 2.1 | The same lookup up to four times per line |
| Custom move order package | 4,900,000,000 | none | 0.06 | Six selects from dual inside a nested loop |
| Custom AutoInvoice preprocessing | 2,950,000 | 84,000 | 1.7 | A check per open order that never returns a row |
The typical finding is not a statement with a bad execution plan. It is a statement that is cheap enough to go unnoticed and runs millions of times: a lookup inside a loop, a check repeated for every row, a program scheduled every few minutes that scans a whole table to find nothing. The fix is in the code around the statement: read once and cache, restrict to what changed, join instead of looping.
On a pluggable database, AWR records the EBS statements only with awr_pdb_autoflush_enabled=true; see DBA AWR Blitz Reports with pluggable databases. Set it a few days before the review.
5. Memory: the SGA is usually too small
DBA SGA+PGA Memory Configuration shows the physical memory and CPUs of each node next to the SGA and PGA settings, the PGA actually used, and the Wait IO percentage of the last week: the share of the statements’ time that went into waiting for disk reads instead of CPU.
The typical finding: often most of the server’s memory is not assigned to anything. The SGA was sized when the system was installed, the hardware has been replaced since, and nobody raised it. Many environments use less than half of their memory. The most extreme case we have seen was an Exadata with two nodes of 750 GB each and an SGA of 8 GB, 1% of the memory.
The Wait IO percentage tells how much that costs, and how much faster the system gets with a larger SGA. The three systems above:
| First system | Second system | Third system | |
| Physical memory per node | 1.38 TB | 708 GB | 1.51 TB |
| SGA | 300 GB, 22% of the memory | 300 GB, 42% of the memory, of which 142 GB buffer cache | 100 GB, 7% of the memory |
| Wait IO percentage of the last week, per node | 2.4% and 4.4% | 17.3% and 12.4% | 16.5% and 11.4% |
Every block that does not fit the buffer cache is read from storage again, so memory that is paid for and left unused shows up as Wait IO. As long as memory is unassigned, any Wait IO is waiting time that this memory would remove, so the recommendation is always to use the full memory, at 2% as at 17%. The percentage only tells how large the gain is. It is also the quickest gain of the whole review: a parameter change and a restart.
The review sizes the SGA by calculation, from the physical memory minus the operating system, the other databases on the server and the PGA at its peak (800 GB for the first system), and gives the hugepages setting that goes with it, since an instance with use_large_pages=ONLY does not start when hugepages are short. The details are in How to configure hugepages for Oracle EBS.
6. Parameters and maintenance jobs
DBA Database Parameter Validation compares every database parameter with Oracle’s requirements for EBS. Typical findings are hidden parameters set years ago for a problem long gone, parameters from the removal list that are still set, and _optim_peek_user_binds=false, which EBS does not require and which is behind much of the plan instability we see.
DBA Automated Maintenance Tasks shows the database’s own optimizer statistics job, space advisor and SQL tuning advisor. EBS gathers its statistics with the Gather Schema Statistics concurrent program, so the database’s statistics job must be off; where it is on, it competes with the workload every night and changes statistics behind the applications’ back.
DBA AWR Wait Event Summary puts the findings in proportion: a system that waits on reads gains from the SGA increase, a system that is on CPU gains from the code corrections.
7. Literal SQL
DBA SGA SQL Performance Summary groups the statements in the shared pool that differ only in their literal values. Code that builds SQL as text with the ids in it creates a new cursor for every call, each of which is parsed from scratch and takes shared pool memory. One of the systems above held 163,000 such cursors from a single module, another 126,000.
In custom code the correction is a bind variable. EBS requires cursor_sharing=EXACT, so there is no database setting that fixes it. Where the code is Oracle’s, the result is a service request.
8. Getting the source code
To correct code, the AI needs the code. If your custom code is in Git, that is where it reads it. Where it is not at hand, three reports export it from the instance: DBA Text Search exports the source of the packages named in the top SQL, DBA Objects with Show DDL set to Yes exports the definitions of the tables, indexes and views they use, and the Blitz Report Custom Reports Converter gathers custom reports and concurrent programs with their definitions and dependent objects.
A custom report among the top statements is treated differently from a package. A data report is replaced by a tuned Blitz Report, either one from our library or a conversion of the custom report; only printed documents such as invoices and pick slips are corrected in place.
9. The AI skill
The method is published as the skill EBS Performance Review, part of the Enginatics AI skills for Oracle EBS. It tells the AI which reports to ask for, how to read them, how to size memory, which code patterns recur and how to correct them, how to verify a correction without access to the database, and what to deliver. It comes with the scripts that turn the report outputs into the review. Read it if you want the details; it is the same text our own AI works from.
10. The result
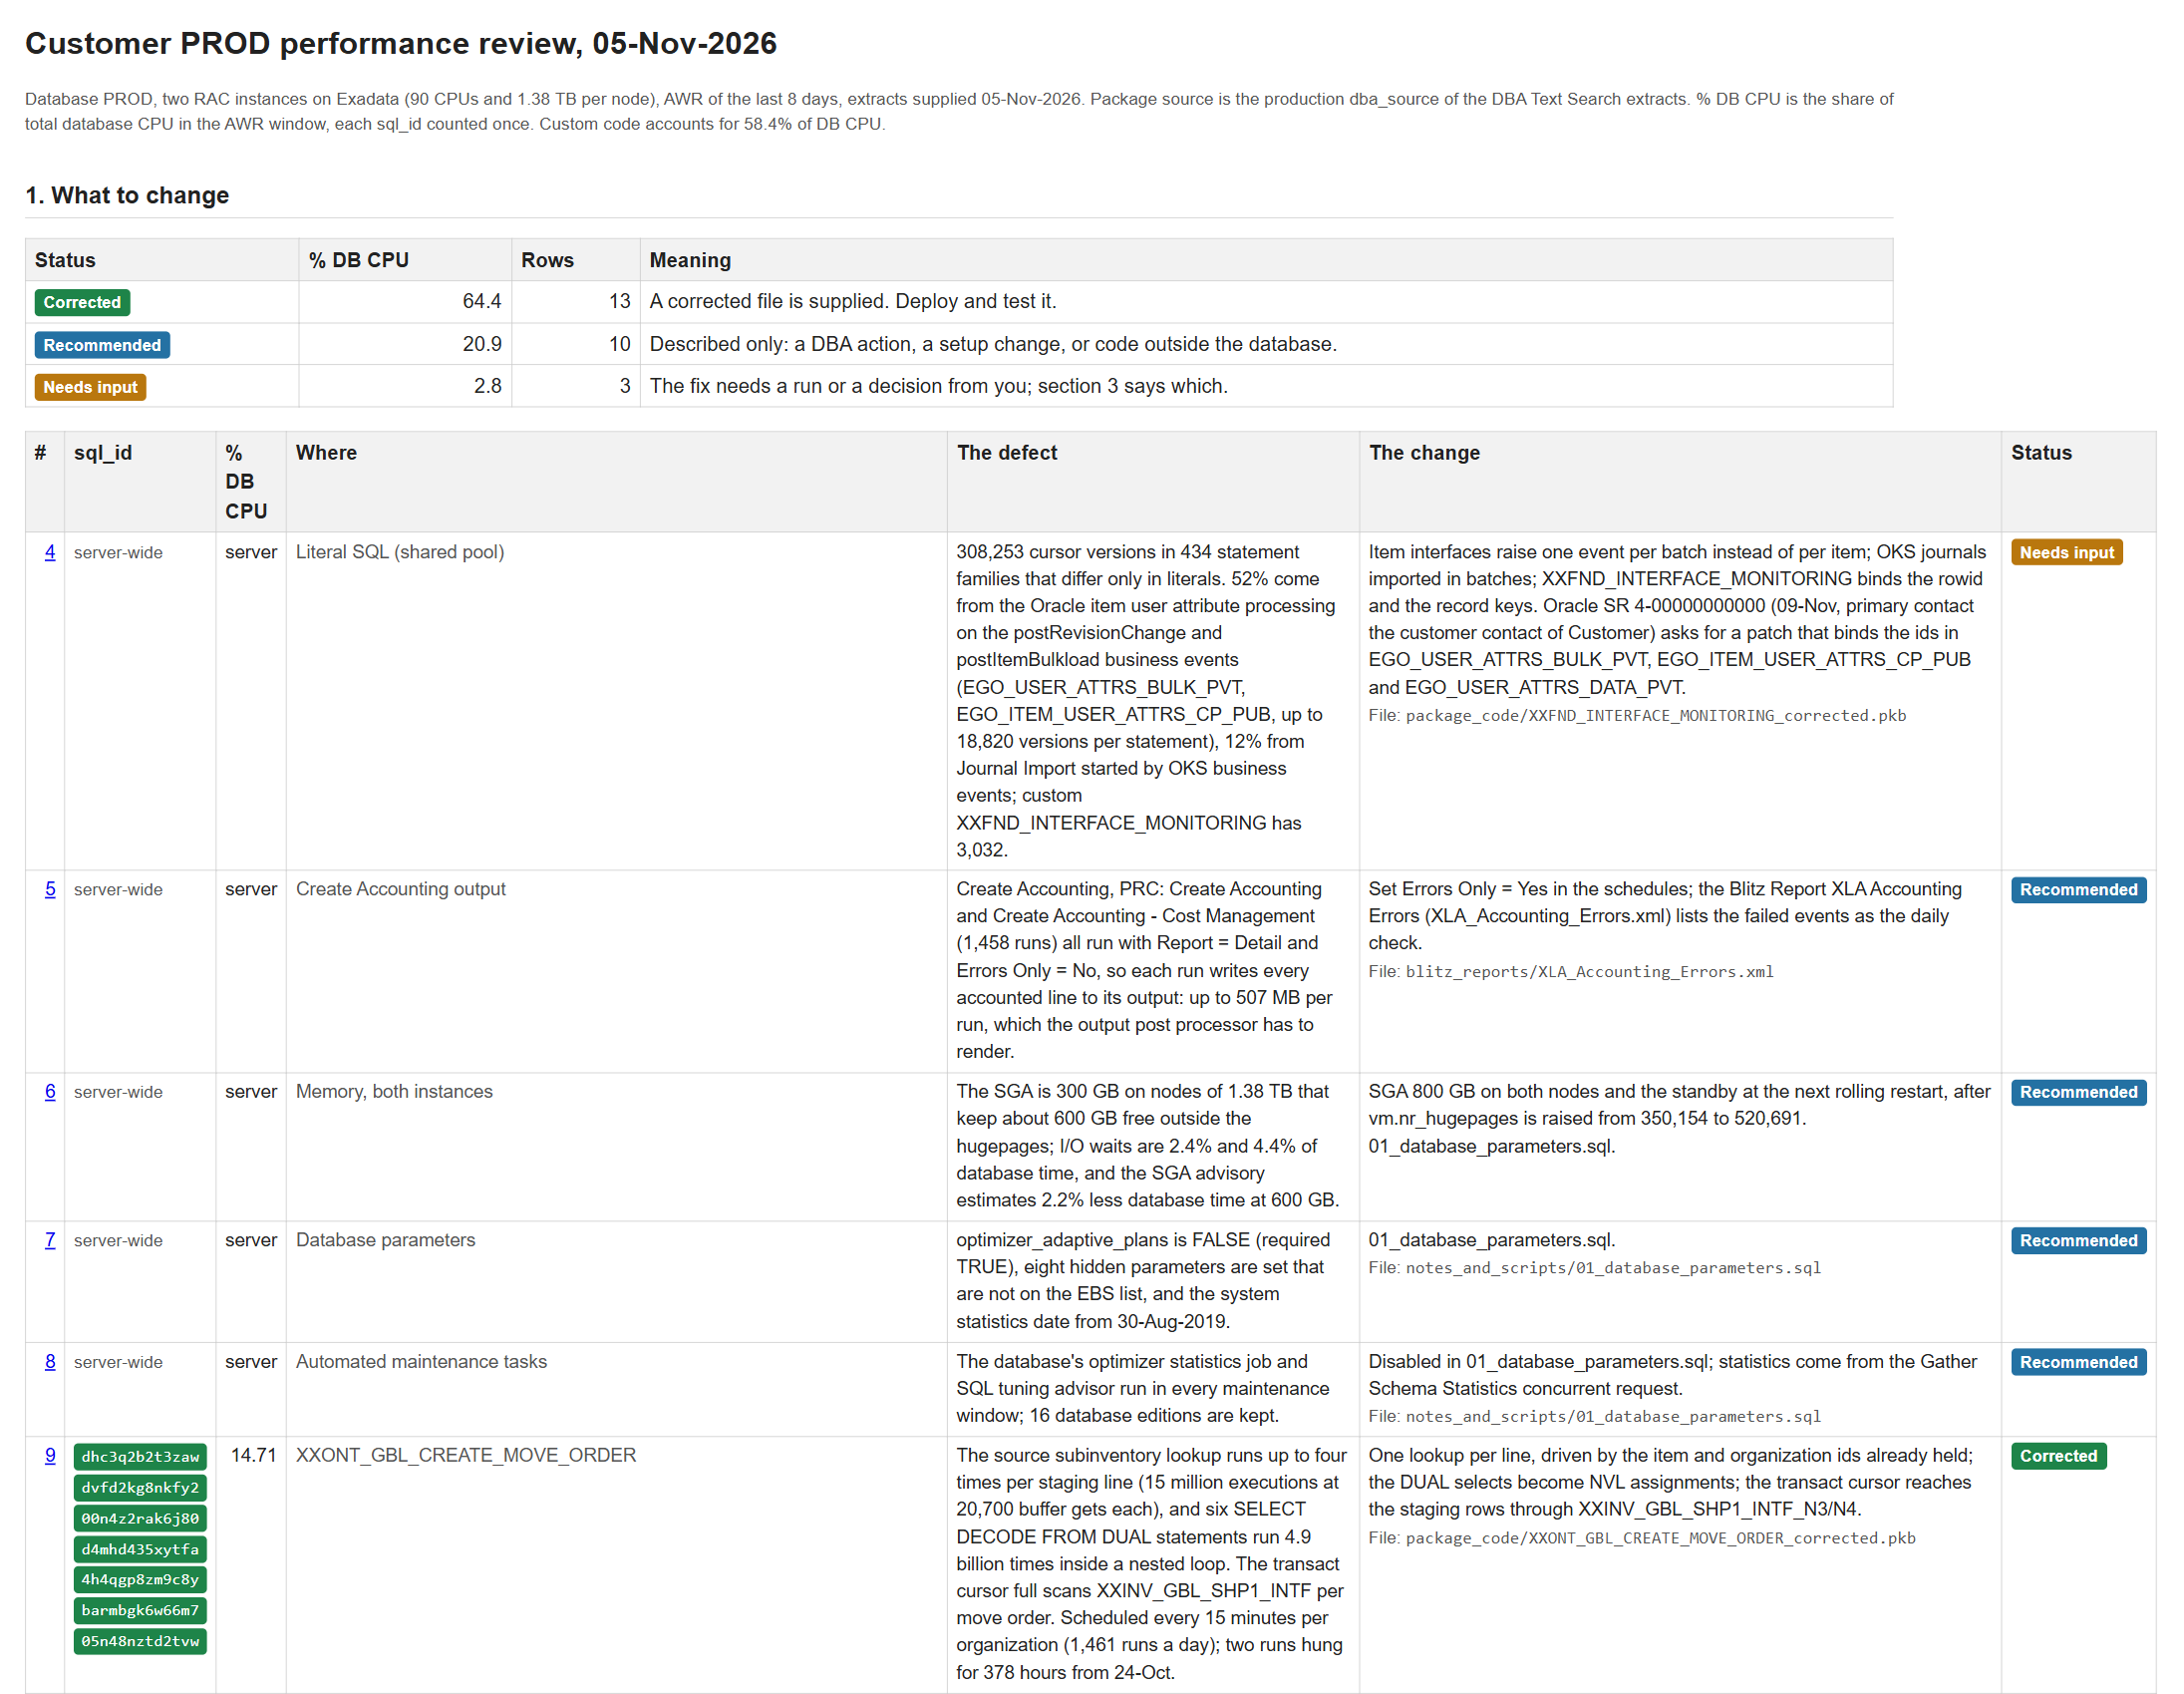
The review is one HTML page. It starts with a single table: every problem with its share of the database CPU, the defect, the change, and a status that says whether corrected code is supplied or the change is described. After it comes the order of deployment and the evidence for each row. Every corrected package is delivered next to its original, so that a developer can compare the two with the own tool, together with the scripts for the DBA.
11. Run it yourself, or send us the outputs
To run the review yourself:
- Run the reports of section 3 on production and save the outputs in one folder.
- Install Claude Code and the Enginatics AI skills, and ask for a performance review of that folder.
- Give the AI an EBS instance to compile and test the corrected code on. A local Vision VM serves this without connecting AI to any of your environments; the setup is described in Oracle EBS custom code development with AI: setup guide.
- Review the corrected packages, deploy them through your own release process, and compare the next week’s AWR with this one.
One point for your security review: the AWR and SGA outputs contain SQL text, and SQL written with literals can contain business values such as names or account numbers. Check the outputs against your policy before giving them to an AI tool.
Or let us do it: run the reports, contact us and send us the Excel outputs. You receive the review with the corrected code.