Introduction
Blitz Report is an Oracle Forms based software, fully integrated with Oracle E-Business Suite. It enables your IT team to easily store and edit SQL scripts for reports, and to make them available to your business users. Blitz Report runs as a concurrent process and generates output files in XLSX or text delimited CSV format. Upon completion, reports automatically download and open in Excel.
With Blitz Report, we created the most efficient and easy to use operational reporting solution for Oracle EBS. Optimized for skilled IT professionals to better organize and maintain their reporting queries, and for business users to quickly access EBS data in a format they love without having to learn new skills.
We hope that you will enjoy working with Blitz Report as much as we do, and we welcome your feedback to [email protected].
1 Running Blitz Report
Basic steps to run a Blitz Report are:
There is a  training video available on selecting and running reports.
1.1 Selecting a report
When opening Blitz Report for the first time, a selection of available reports is displayed automatically. The list can be restricted further by typing the first characters of the desired report name.
When subsequently opening Blitz Report, the last report executed will default in the report name field. If you open the reports LOV, all of your “most frequently used” reports will be listed at the top of the list. You can still scroll down, or use the following selection options for finding and selecting reports:
- Perform a text search by typing into the report name field. This executes a full text search on report name and description, parameters, SQL definition, template name and description, enabling you to search by column names, for example. The search is not case sensitive and allows creation of logical expressions using keywords ‘and’ or ‘or’ and use of brackets to group sub-expressions.
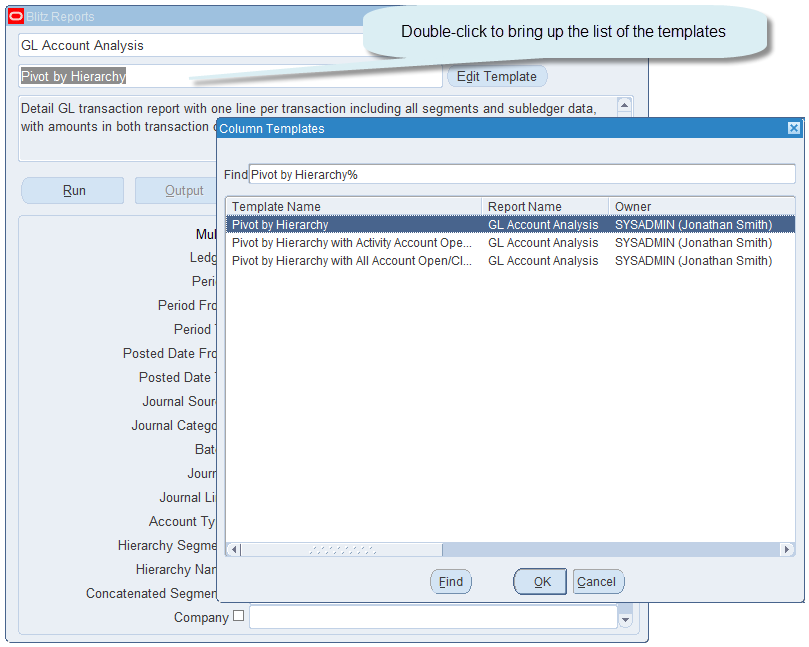
- Double click into the report name field
- Use the LOV attached to the report name
- Press the F1-key
- Pick a Category from the dropdown list
- Use the find/torch menu symbol
- Run a query on the report name or description fields via F11, Ctrl+F11
By default, users can select from reports assigned to their current logon responsibility only, but the LOV of reports can be extended by setting profile option Blitz Report Filter Reports by Responsibility to ‘No’. This way, users will see all the reports assigned to them, regardless of their current logon responsibility.
Text search example:
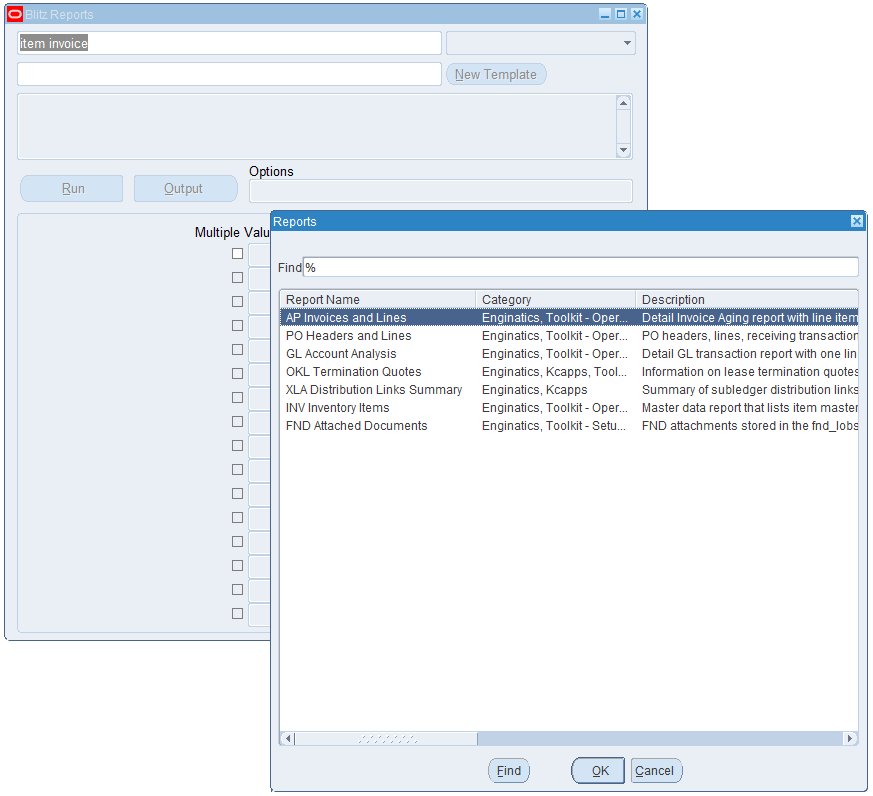
Scrolling further to the right in the search results shows the matching score and fields in which the keywords are found.
When entering multiple keywords, the search matches all keywords by default.
Above example lists all reports containing both words, ‘item’ and ‘invoice’.
To search on either of the keywords, combine them with ‘or’.
To search for an exact match in the order of keywords e.g. ‘item’ directly followed by ‘invoice’, enclose them into quotation marks such as “item invoice”.
1.2 Parameter values
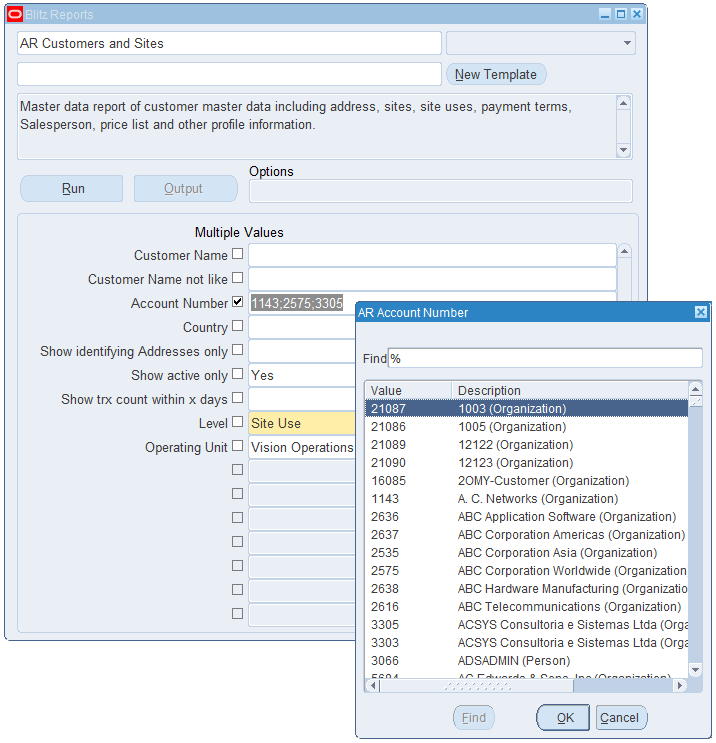
Report parameters filter, limit or define the extracted data. Parameters can have lists of values that either enforce selection of one particular value (e.g. account number) or that allow matching by wildcards such as ’%’ or ‘_’.
To display the LOV for a parameter, double click either into the parameter value field or on the three LOV dots on the right.
Some parameters may allow entry of multiple values, depending on the definition of the parameter (see here for details).
To run a report for a list of account numbers for example, check the ‘Multiple Values’ checkbox next to the parameter and either select account numbers one by one from the LOV or enter a semicolon-separated list of numbers manually.
Larger lists of multiple parameter values up to a length of 32000 characters can be entered using the ‘Edit Field’ menu function.
Multiple values can be separated by semicolon or line feed. Using the ‘Edit Field’ menu icon, you can for example copy and paste a list of parameter values directly from an Excel sheet.
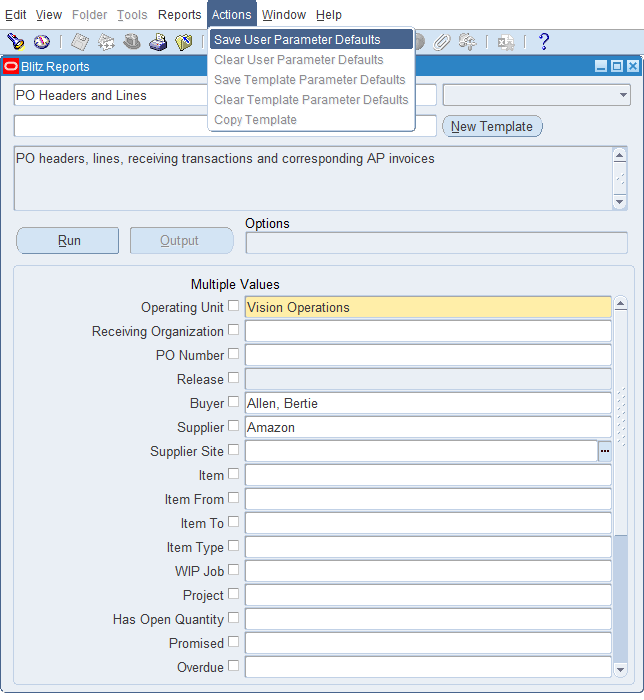
Users can store their own default parameter values using the Actions > Save User Parameter Defaults menu option.
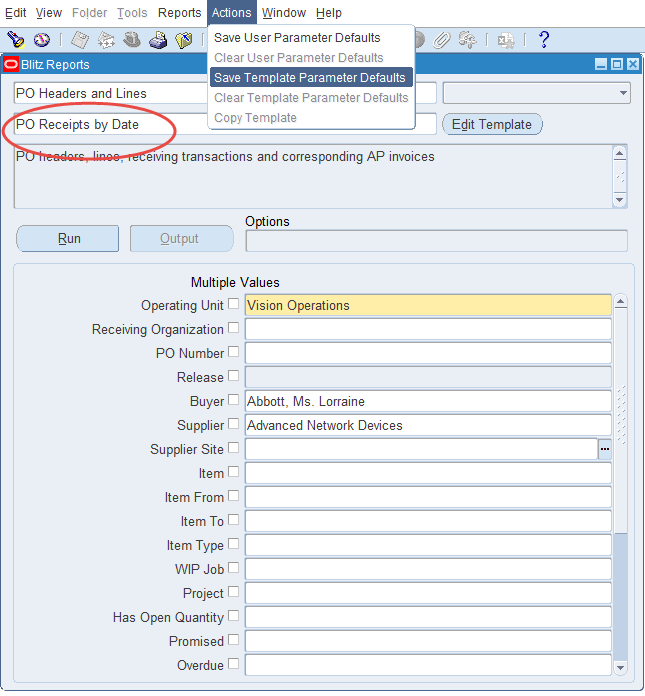
Once a template is selected it is also possible to store default parameter values against a template using the Actions > Save Template Parameter Defaults menu option.
1.3 Running and viewing the output
A click on the ‘Run’ button launches a background concurrent process to extract the report data. The output XLSX file opens automatically upon program completion.
While the report concurrent process is pending or running, the request status is displayed on the output button. Once the report is complete, the output button can also be used to re-download the output file.
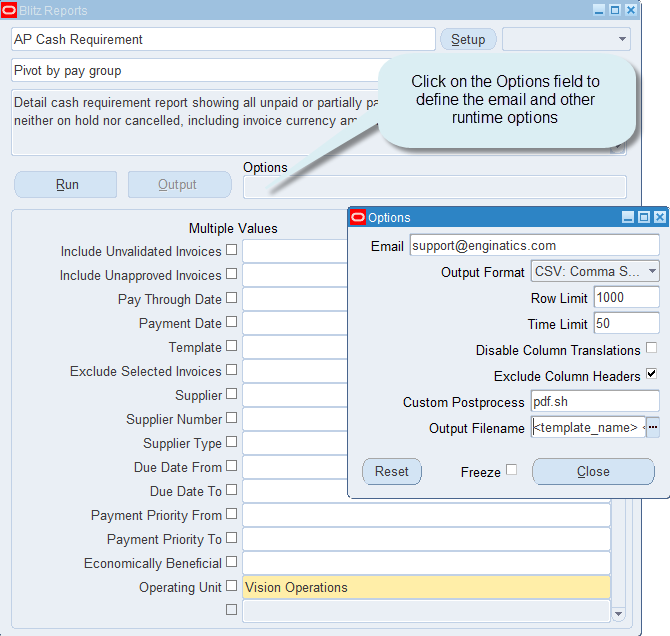
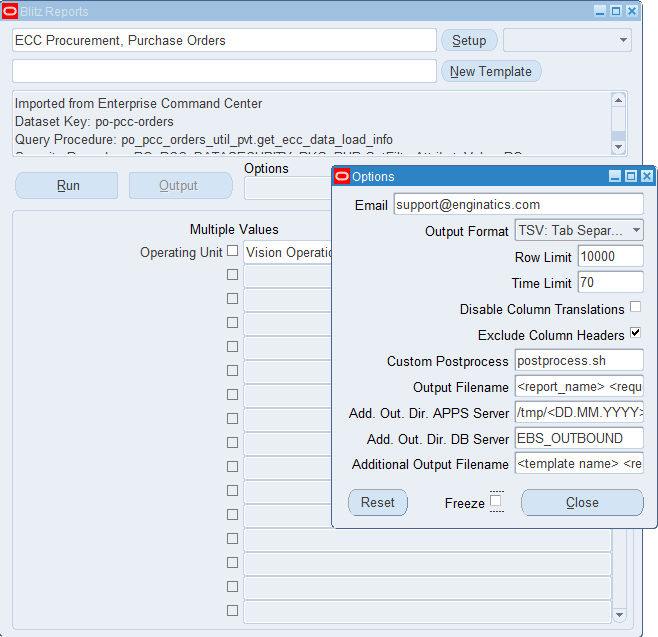
The Options window is accessed by clicking on the grey options field. It allows controlling the report generation process and the output format at run time, for example email delivery and output formats. Some options are available only for developers. The runtime options inherit their default values from the Blitz Report Setup Window options with the same names.
User view:
Developer view:
Enter an e-mail address that you wish to send the report output to. Multiple email addresses can be entered as a comma-separated list. Developers can define a default email address for individual reports, or you can set up a default email throught profile option Blitz Report Default Email Address.
The default email subject for Blitz Reports is stored in FND message XXEN_REPORT_EMAIL_SUBJECT. To change this text, navigate to Application Developer > Application > Message > query message XXEN_REPORT_EMAIL_SUBJECT and edit the message text.
You can use the following placeholders for automated replacement at run-time:
&REPORT_NAME &ROW_COUNT &DB_NAME &USER_NAME &REQUEST_ID &SITE_NAME |
You can also create new custom messages. Prefix these with XXEN_REPORT_EMAIL and use them as default email subjects by setting the profile option Blitz Report Email Subject Message.
Output Format
Output file format. Possible options: CSV, TSV, XLSX
Row Limit
You can restrict the number of row in the output file by indicating that option.
Time Limit
Indicates timeout in seconds. Program is terminated by the ‘Blitz Report Monitor’ after indicated time. This avoids excessive server loads if e.g. user submits report with insufficient parameter restrictions.A time limit can also be set when running reports or using profile option Blitz Report Time Limit. If there are values set on different levels, the order of precedence is as follows:
- Run window options time limit
- Profile option on user level
- Time limit on report level
- Profile option on responsibility level
- Profile option on site level
Disable Column Translations
Disabling translation of the report’s header if multi-language setup is in place. E.g.: interface requirements.
Exclude Column Headers
Removing header column from the output file. E.g. for interface requirements
Custom Postprocess
A custom post-processing shell script can be set up to run after report completion, for example to distribute or transform the output file to a different format, such as generating a report in PDF format.
The script must be placed under the $CUSTOM_TOP/bin/custom/ directory, for example $XXEN_TOP/bin/custom/generate_and_send_pdf.sh, and it allows the use of variables as shown in the following example:
# You can use a custom postprocess script to perform additional actions on the Blitz Report output files, e.g. scp them to a different server, transform them to .pdf via external tools etc. # This script is called with following parameters: # $FCP_LOGIN example: APPS/w#*fe=+~12fweDg # $p_report_name example: AP Suppliers # $p_template_name example: Pivot by supplier type # $p_request_id example: 6590137 # $outfile_name example: /d01/oracle/VIS/inst/apps/VIS_r12/logs/appl/conc/out/AP_Suppliers_6590142.xlsx # $output_filename example: AP_Suppliers_6590142.xlsx # $download_filename example: AP Suppliers 17-Nov-2019 153012.xlsx (user facing browser download name, as served by Oracle EBS forms) # $additional_outfile_name example: /d01/oracle/VIS/inst/apps/VIS_r12/logs/appl/conc/out/AP_Suppliers_20191117.xlsx # $parameter1 # $parameter2 # ....... # $parameter87 # # Example of copying output xlsx file to an interface directory on a remote server: # scp "$outfile_name" [email protected]:/interface_dir |
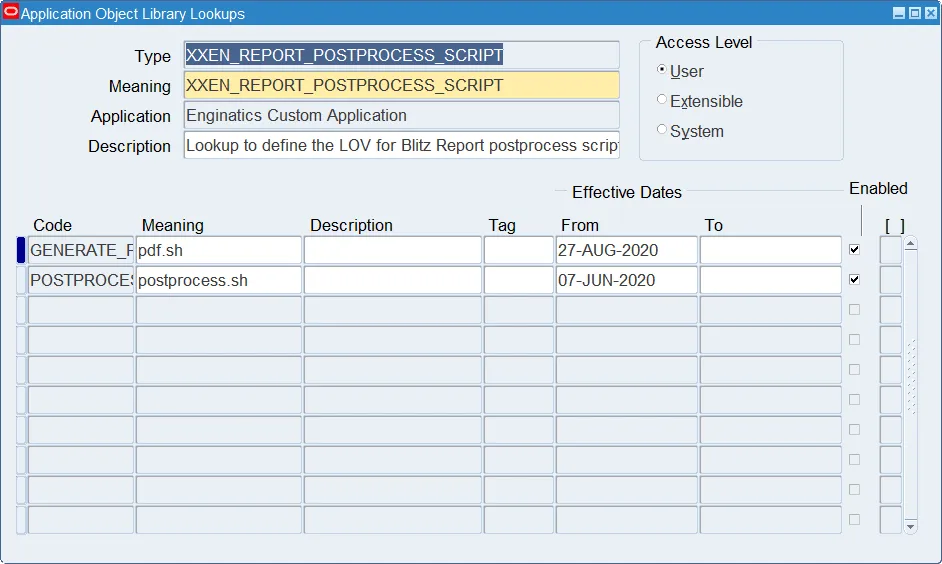
To add a new custom postprocess script name to the runtime options LOV, add it to lookup XXEN_REPORT_POSTPROCESS_SCRIPT as shown in the following screenshot:
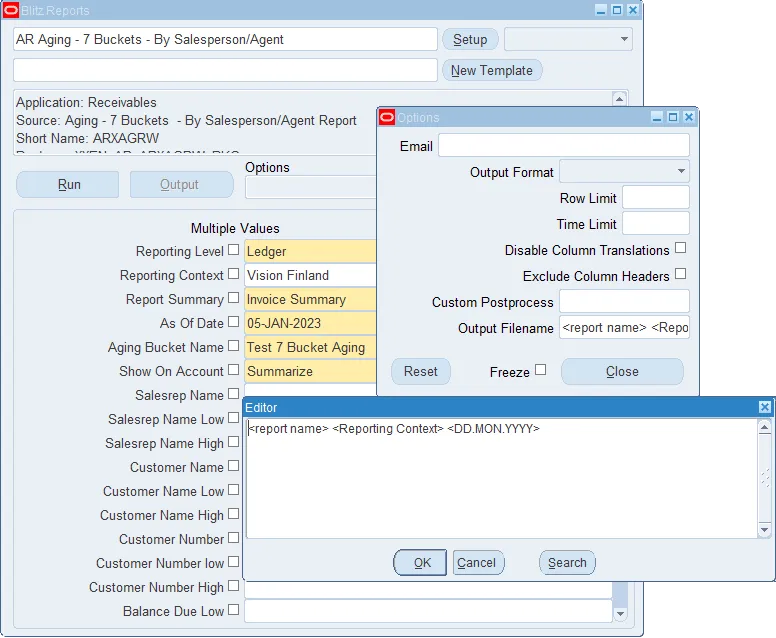
Output Filename
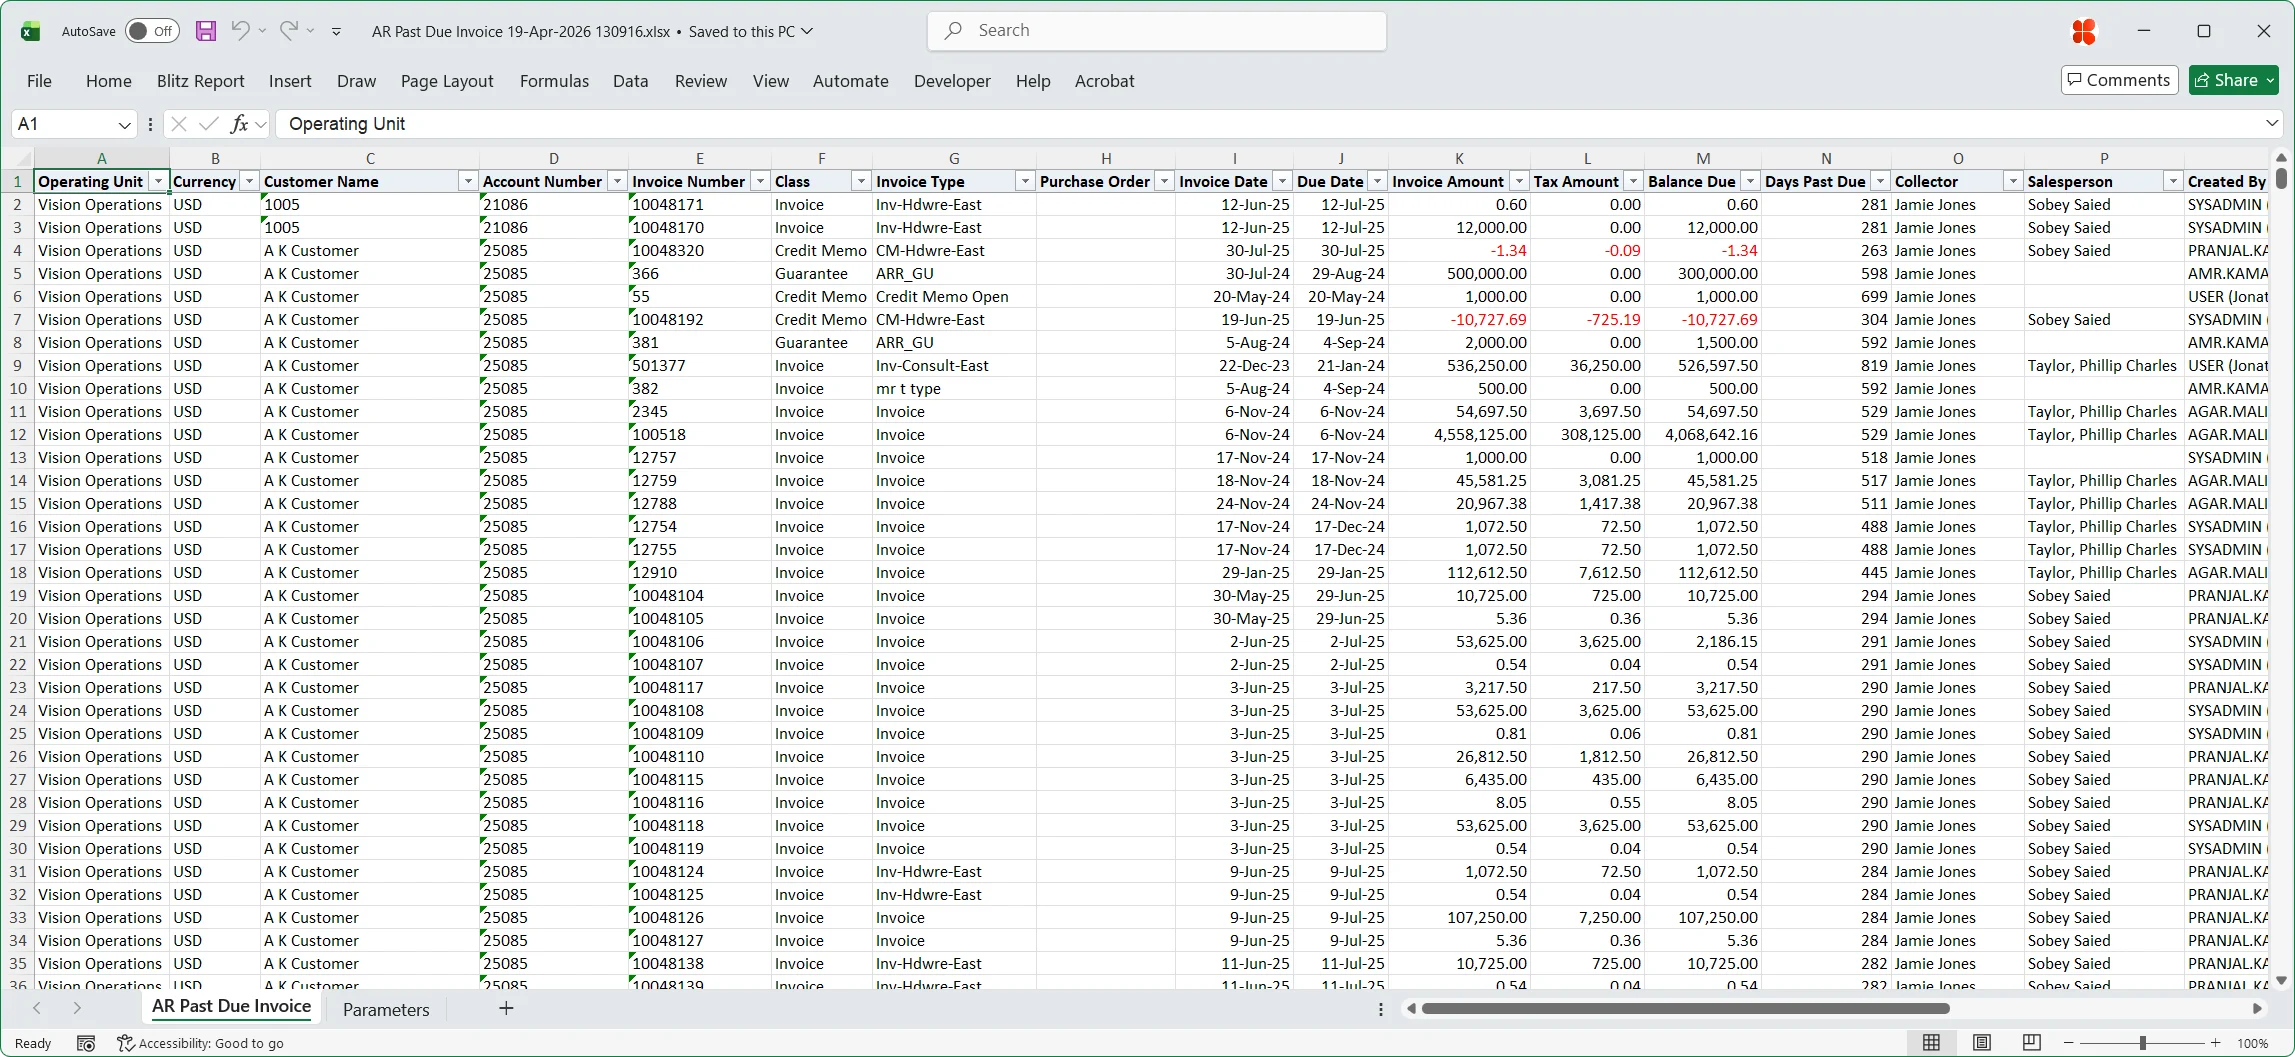
Defines the Excel output file name, downloaded to the client desktop. Tokens can be used to create a filename dynamically, for example based on report parameter values.
Additional Out. Directory on APPS Server (Developer access only)
Saves a copy of the report output file in the specified directory on the application server. This setting can be defaulted by the profile option Blitz Report Additional Output Directory APPS Server. Tokens can be used to create a directory path dynamically, for example based on report parameter values. If the resulting directory does not exist on the filesystem, it is created. Please ensure that the apps owner has the required permissions for the directory creation.
Additional Out. Directory on DB Server (Developer access only)
Saves a copy of the report output file in the specified directory on the database server. This setting can be defaulted by profile option Blitz Report Additional Output Directory DB Server. The list of the available directories is fetched from the dba_directories table.
Additional Out. Filename (Developer access only)
Naming convention for output files if additional output directories are defined. Tokens can be used to create a filename dynamically, for example based on report parameter values.
Reset button
This button is used to set runtime options to the default values based on the profile option or report level settings.
Freeze flag
When checking the freeze flag, option values are not changed or reset to their defaults when navigating to a different report.
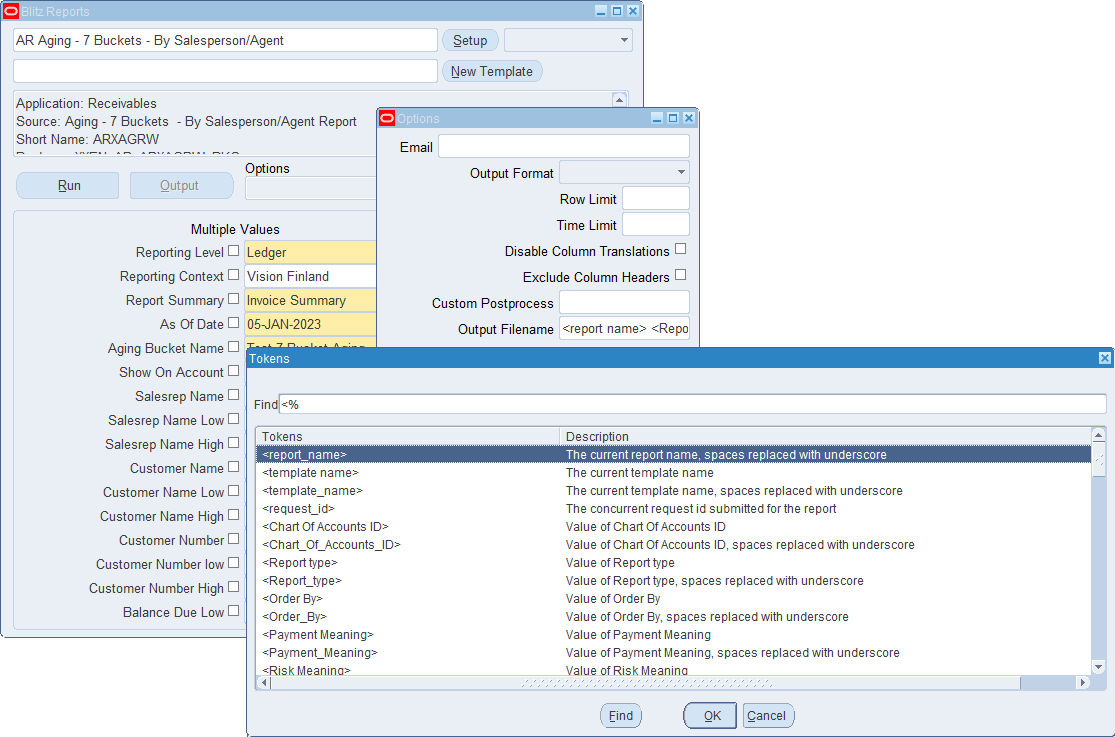
Tokens
You can use any of the below tokens to dynamically generate values for the following runtime options: Output Filename, Additional Out. Directory on APPS Server, Additional Out. Filename.
<report name> – report name
<report_name> – report name, all spaces are replaced to underscores.
<template name> – template name
<template_name> – template name, all spaces are replaced to underscores.
<request_id> – concurrent request id
<parameter name> – value of the specified parameter name
<parameter_name> – value of the specified parameter name, all spaces are replaced to underscores.
<date format string> – actual run date in the specified Oracle date format string
Here is the example of a filename using all of the above tokens, replacing spaces to underscores.
<report_name>–<template_name>–<request_id>-for-<Operating_Unit>-on-<DD-MM-YYYY>
The resulting filename is:
AP_Suppliers-Operating_unit_only-6317575-for-Vision_Operations-on-06-10-2022.xlsx |
Here is the example of the similar filename but without replacing spaces to underscores:
<report name>–<template name>–<request_id> for <Operating Unit> on <DD-MM-YYYY>
The resulting filename is:
AP Suppliers-Operating unit only-6317575 for Vision Operations on 06-10-2022.xlsx |
And here is an example of a directory using tokens:
/interface/<report_name>_<DD-MM-YYYY>
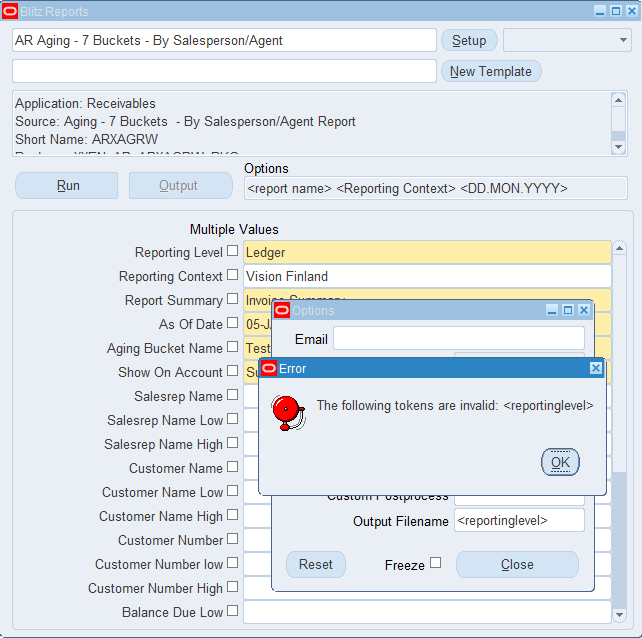
It is possible to enter tokens manually or to choose them from the LOVs associated with the runtime option fields.
Manually entered tokens are validated against the LOV values, and an error message is displayed in case a token is not valid.
1. The file name that is downloaded to the client desktop when opening the Blitz Report output.
2. The output file on the concurrent processing server in directory $APPLCSF/out. This is the attachment file name when sending Blitz Reports via email and the Oracle EBS delivery option.
3. An additional output file placed into a directory either on the application or database server.
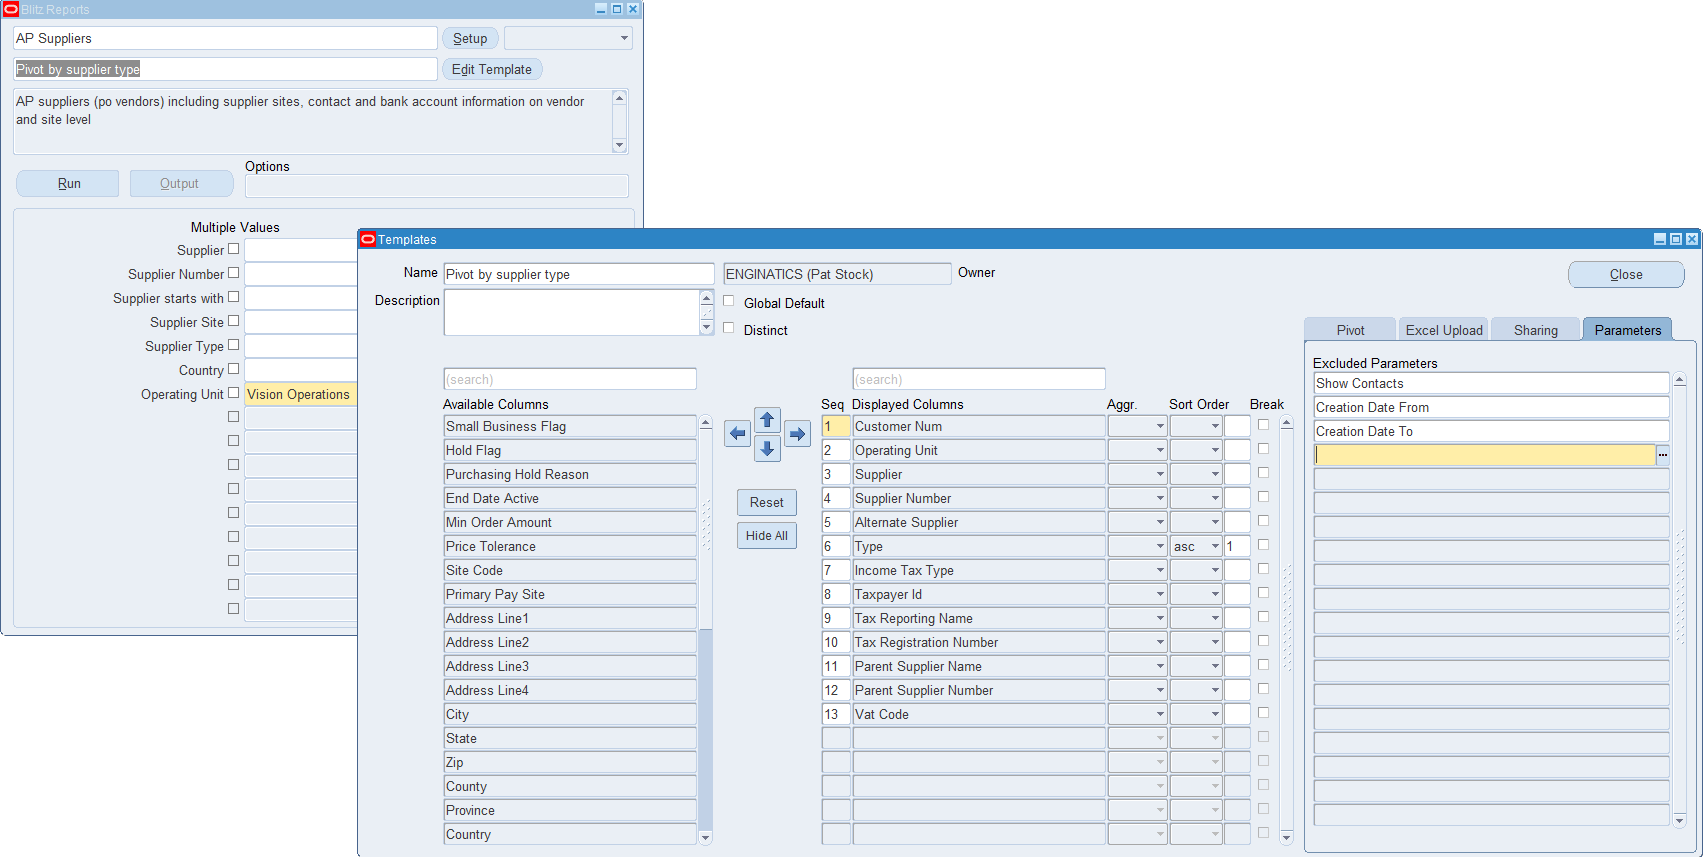
1.5 Templates
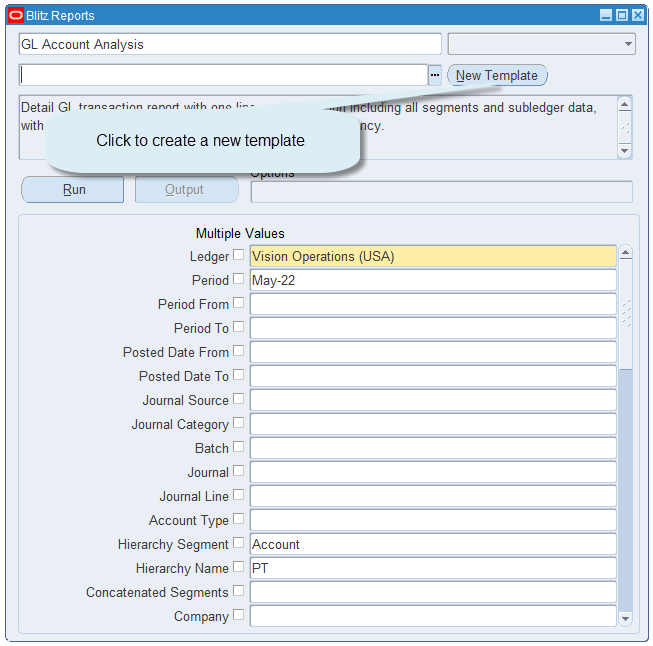
From the options window, you can either select an existing template to edit, or, if the template name is empty, create a new template by clicking on the ‘New’ button. There is a training video available on creating and sharing layout templates.
Template layout
A template allows users to select the data columns, the level of reporting (detail transactional or summarized), aggregation calculations, and to define a pivot table output. Using templates, report columns can be selected and/or de-selected, summarized, and sorted as well as pivoted.
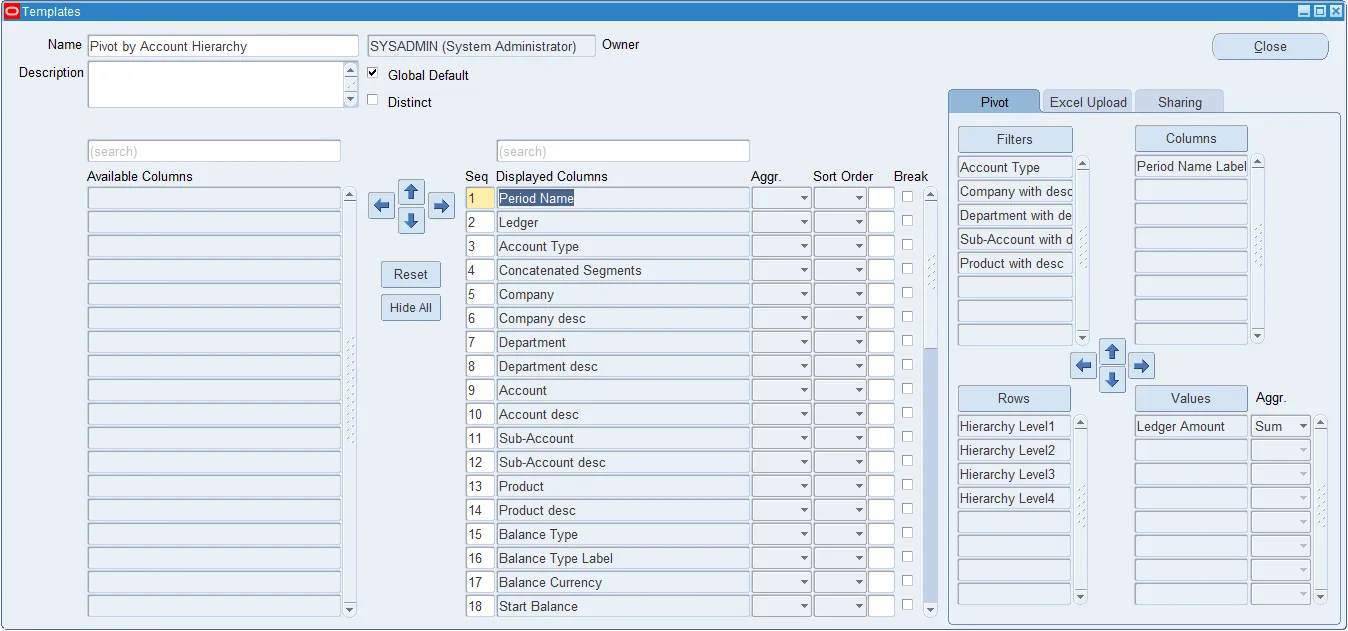
The template window contains the following elements:
Name of the template
Description of the template
Global Default sets the template as the default for all report users (available for developers only)
Distinct suppresses duplicate rows in the report
Owner shows who owns the template. Initially, this is the user who created it. Users with Blitz Report Access level Developer or System, or with Blitz Report Template Access level ‘Super User’, can transfer ownership by double-clicking the owner field. Ownership can be transferred to another user or to a responsibility. If a responsibility owns a template, all users of that responsibility can view and modify it, which is useful for templates maintained by a team
Available Columns – list of columns that are available for display, but are not selected yet
Displayed Columns – list of columns that are selected and included in current report output
Column search can be used to quickly find specific available or displayed columns
Aggr. is used for summary reports and specifies how to aggregate the data (the choices are average, count, min, max, sum)
Sort Order determines the order of the output data (ascending / descending)
Sort Priority determines the sort priority if more than one sort order is selected
Sheet Break allows splitting the output file into different sheets for every column value change
Arrow buttons move columns between “available” and “displayed”, as well as changing their display order. You can use the Ctrl and Shift keys to select groups of columns (multi-select) and move them simultaneously to and from either column. You can use double-click to move data from one column to the other.
Reset button to recover the initial column layout
Hide All button to deselect and move all data off of the “selected” columns and back to the “available” column
Pivot table
The Filters, Columns, Rows and Values fields are used to create and deliver the data in pivot table format with full drill down to details. The data must be selected to print on the report in order to be used in the Pivot table. The pivot table section of the template screen is divided into 4 sections:
Filters – These are the columns you will use to filter the data. Filters are things like GL account, Department, Subaccount, Customer, Vendor, Project or Product, to name a few popular choices.
Columns – This will define which data should appear in separate columns. Period, Project, Subaccount, to name a few popular choices.
Rows – This will define the data summary level for each row in the pivot table.
Values – This will define the numeric data that will be summarized to provide the totals for the level defined in the Row columns.
Aggr. – For the information selected in the “values” section, how to aggregate the data (the choices are average, count, min, max, sum)
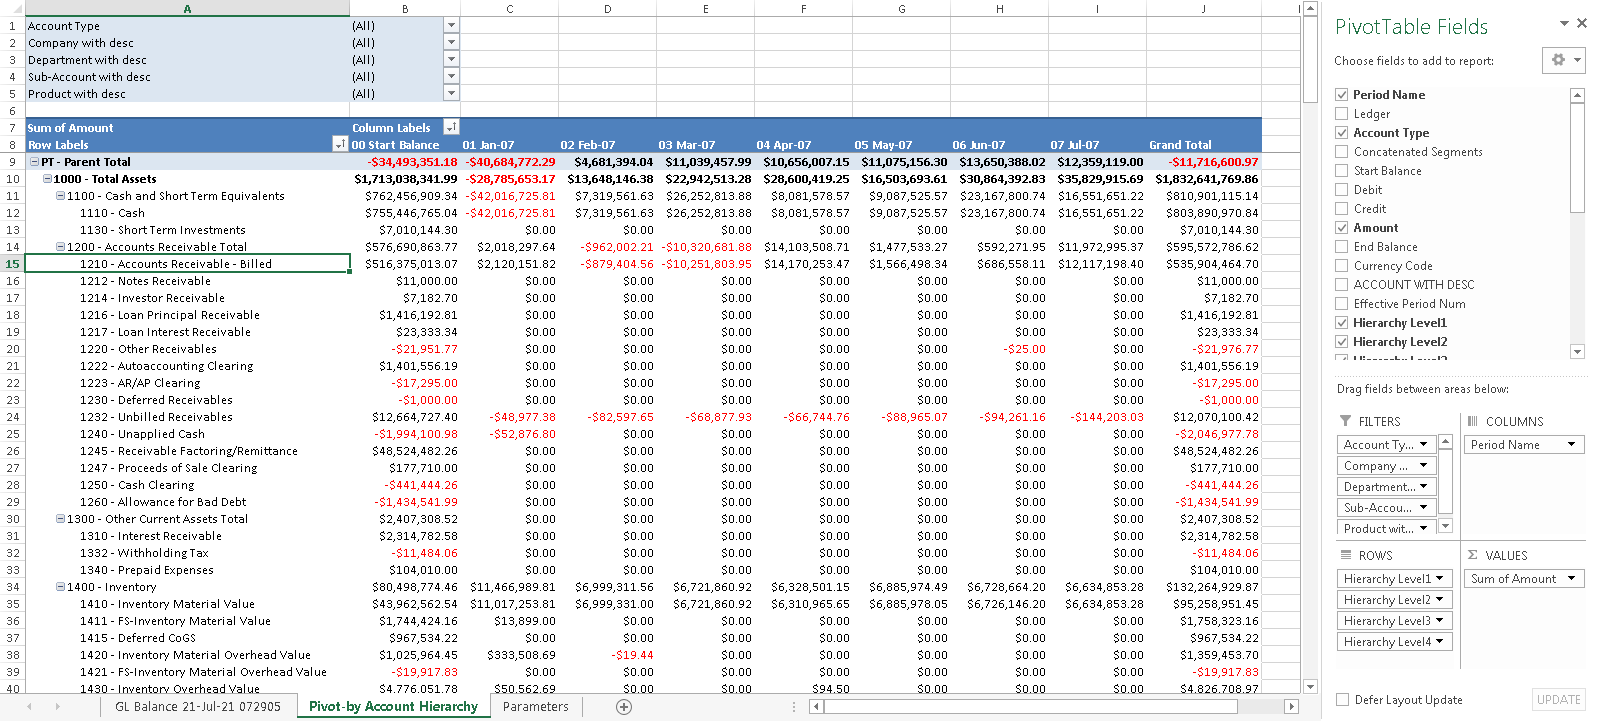
Sample pivot table output:
Excel upload
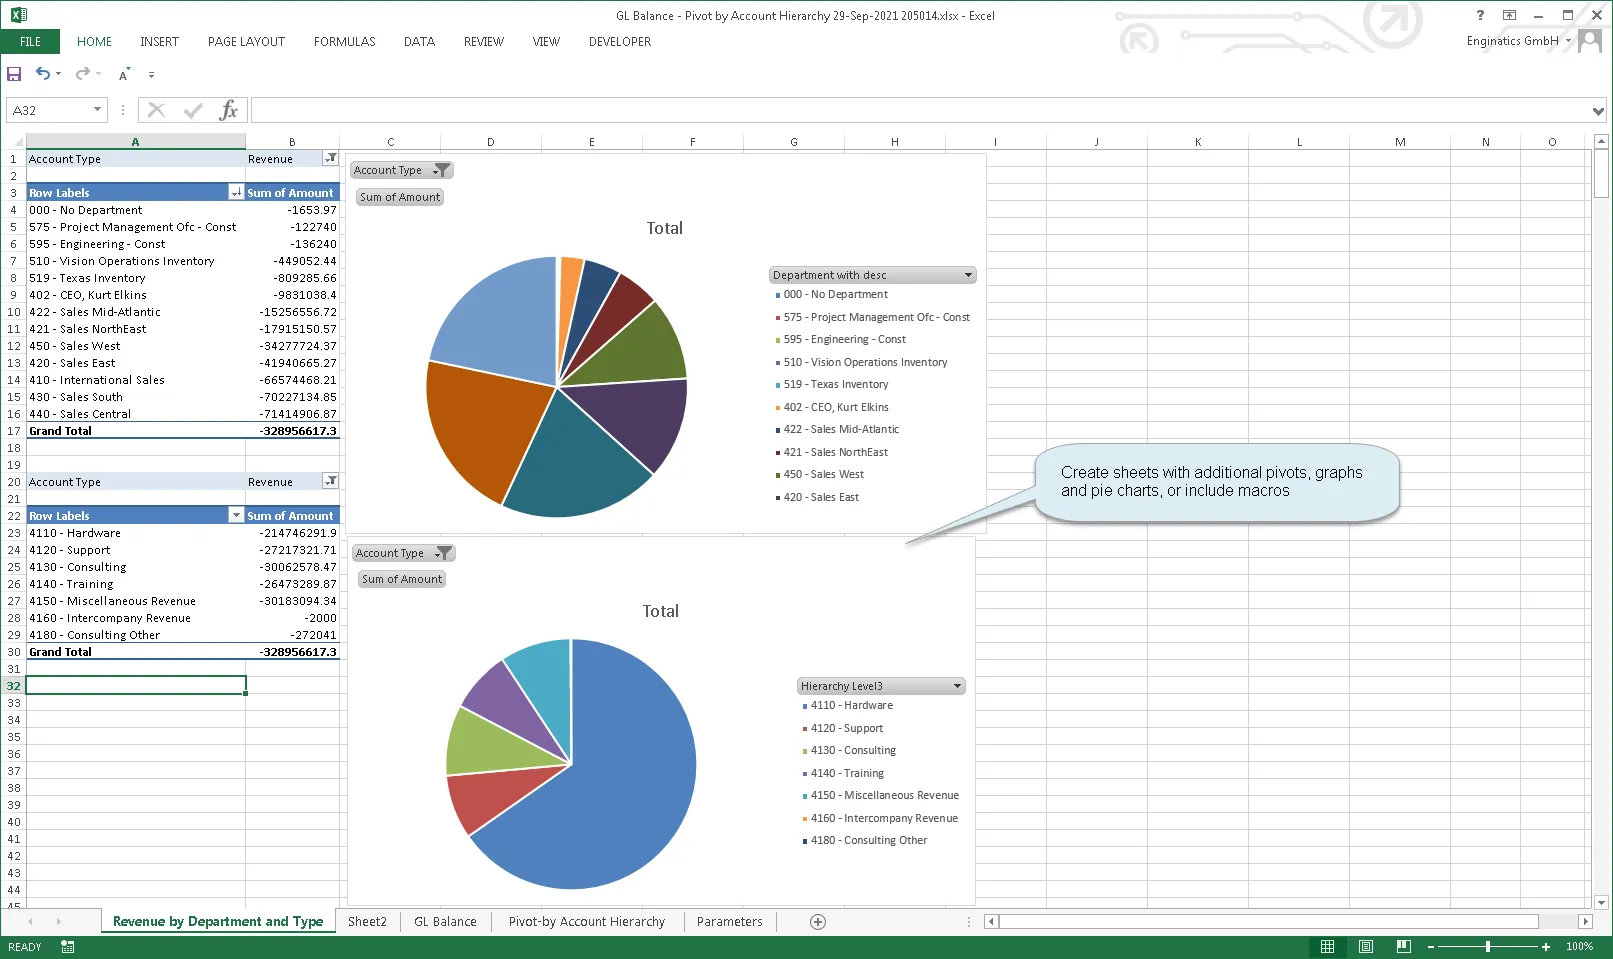
The Excel template upload functionality allows creation of additional sheets with graphs, pie charts, macros or any other Excel functionality. To use this feature, execute the following steps:
- Run a report and open the output
- Create sheets with additional pivots, graphs and pie charts or include macros. Place the data sheet as the first sheet in the workbook.
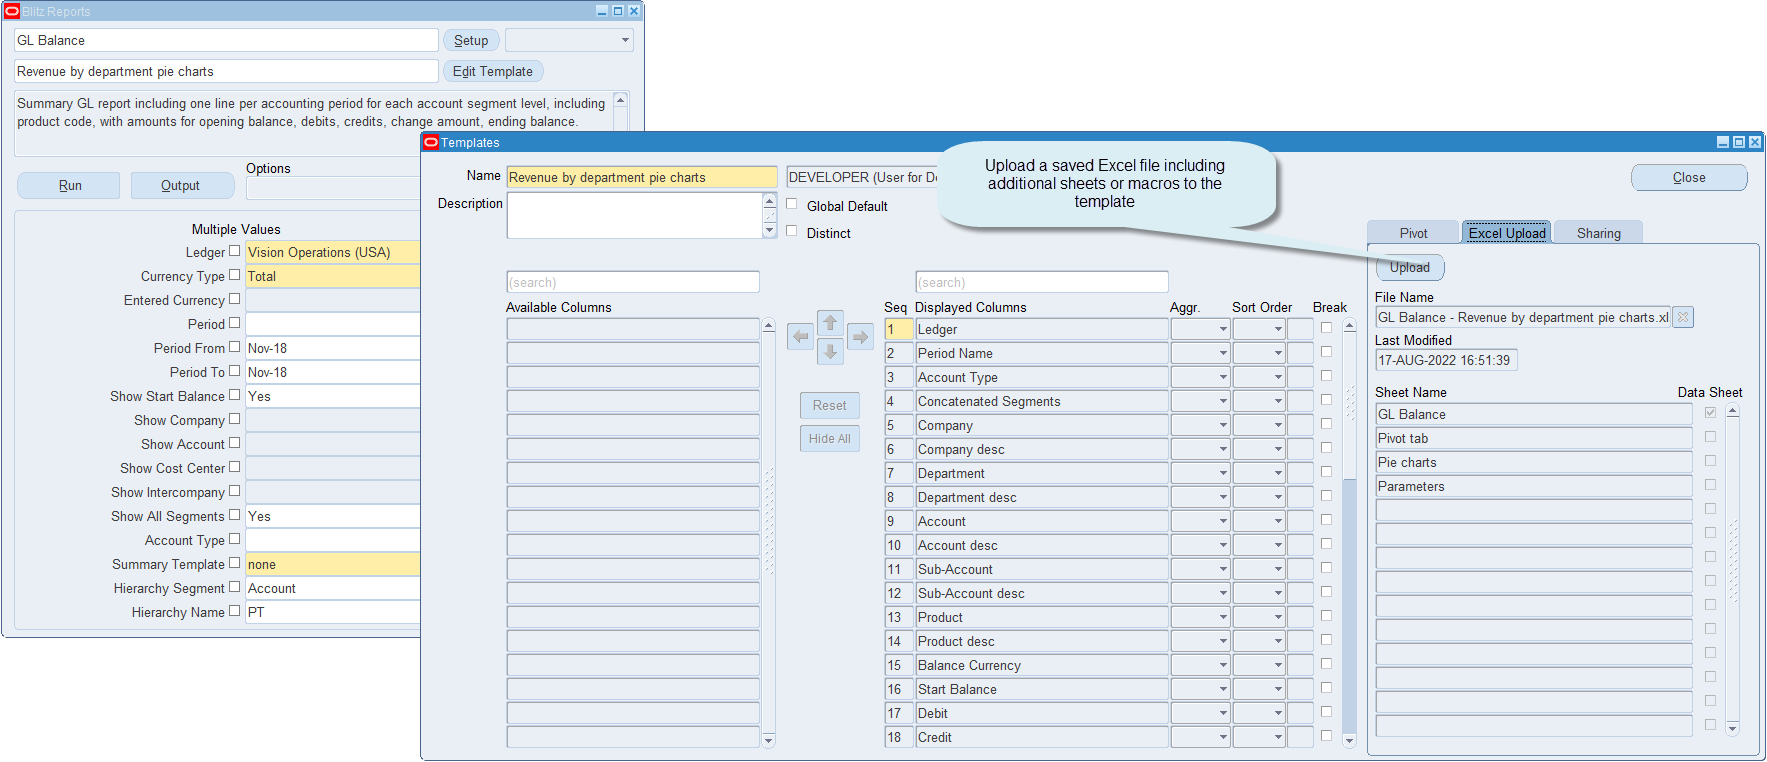
- Upload the saved Excel file including additional sheets or macros to the template
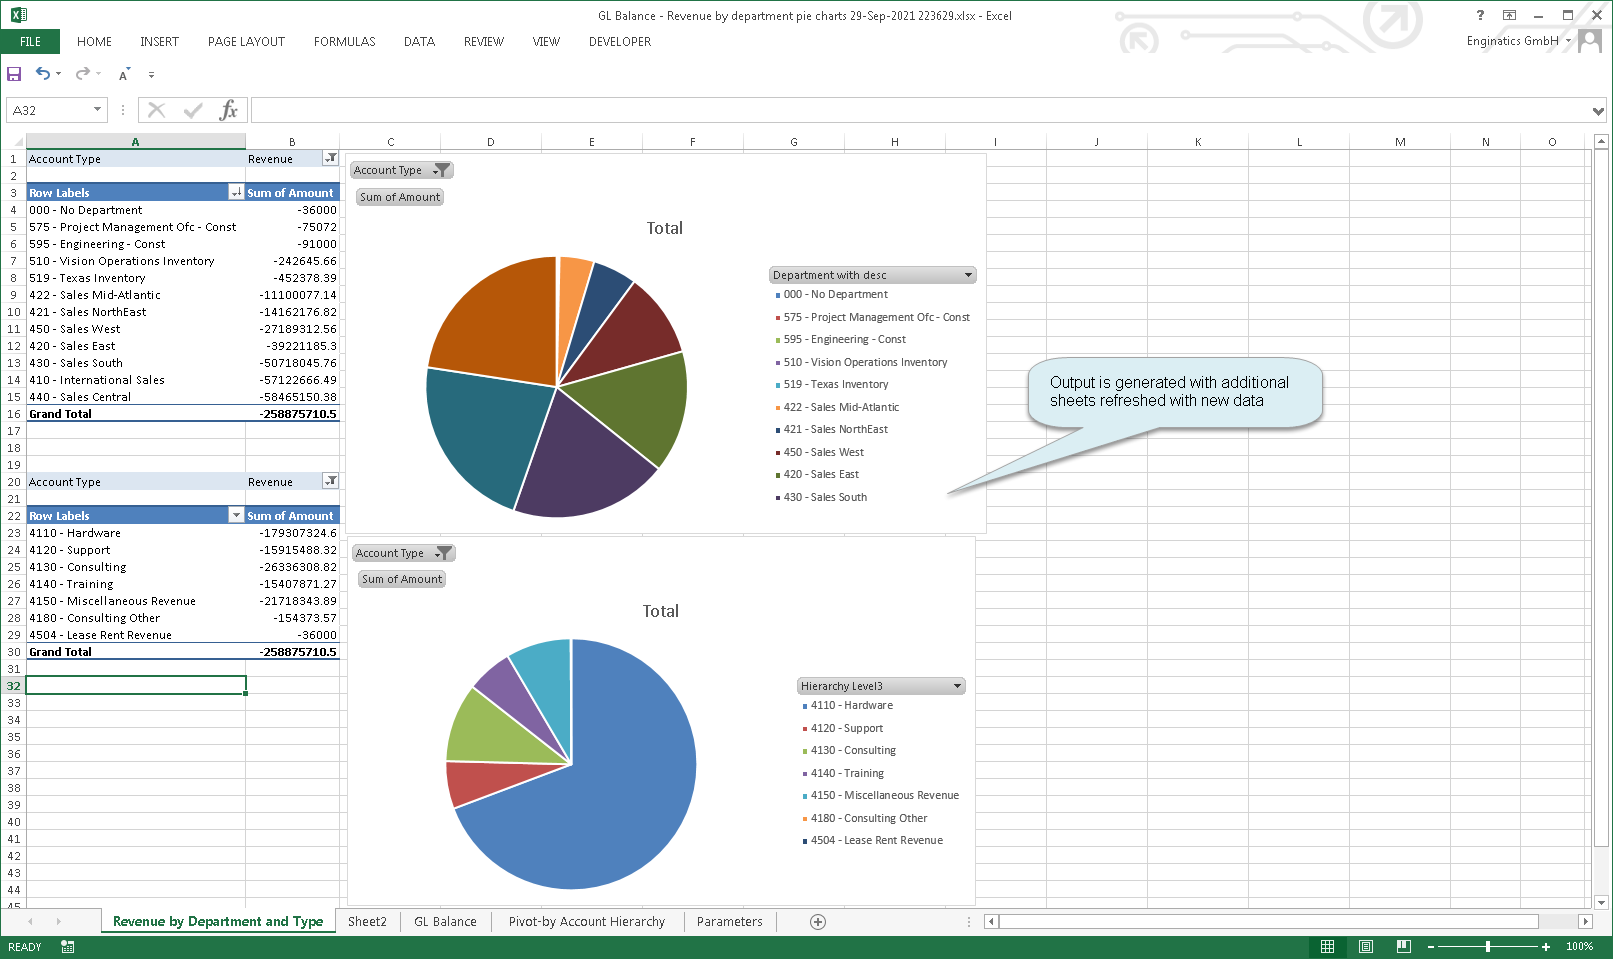
- Run the report again with parameters as required and the output is generated with additional sheets and refreshed with new data
Datasheet
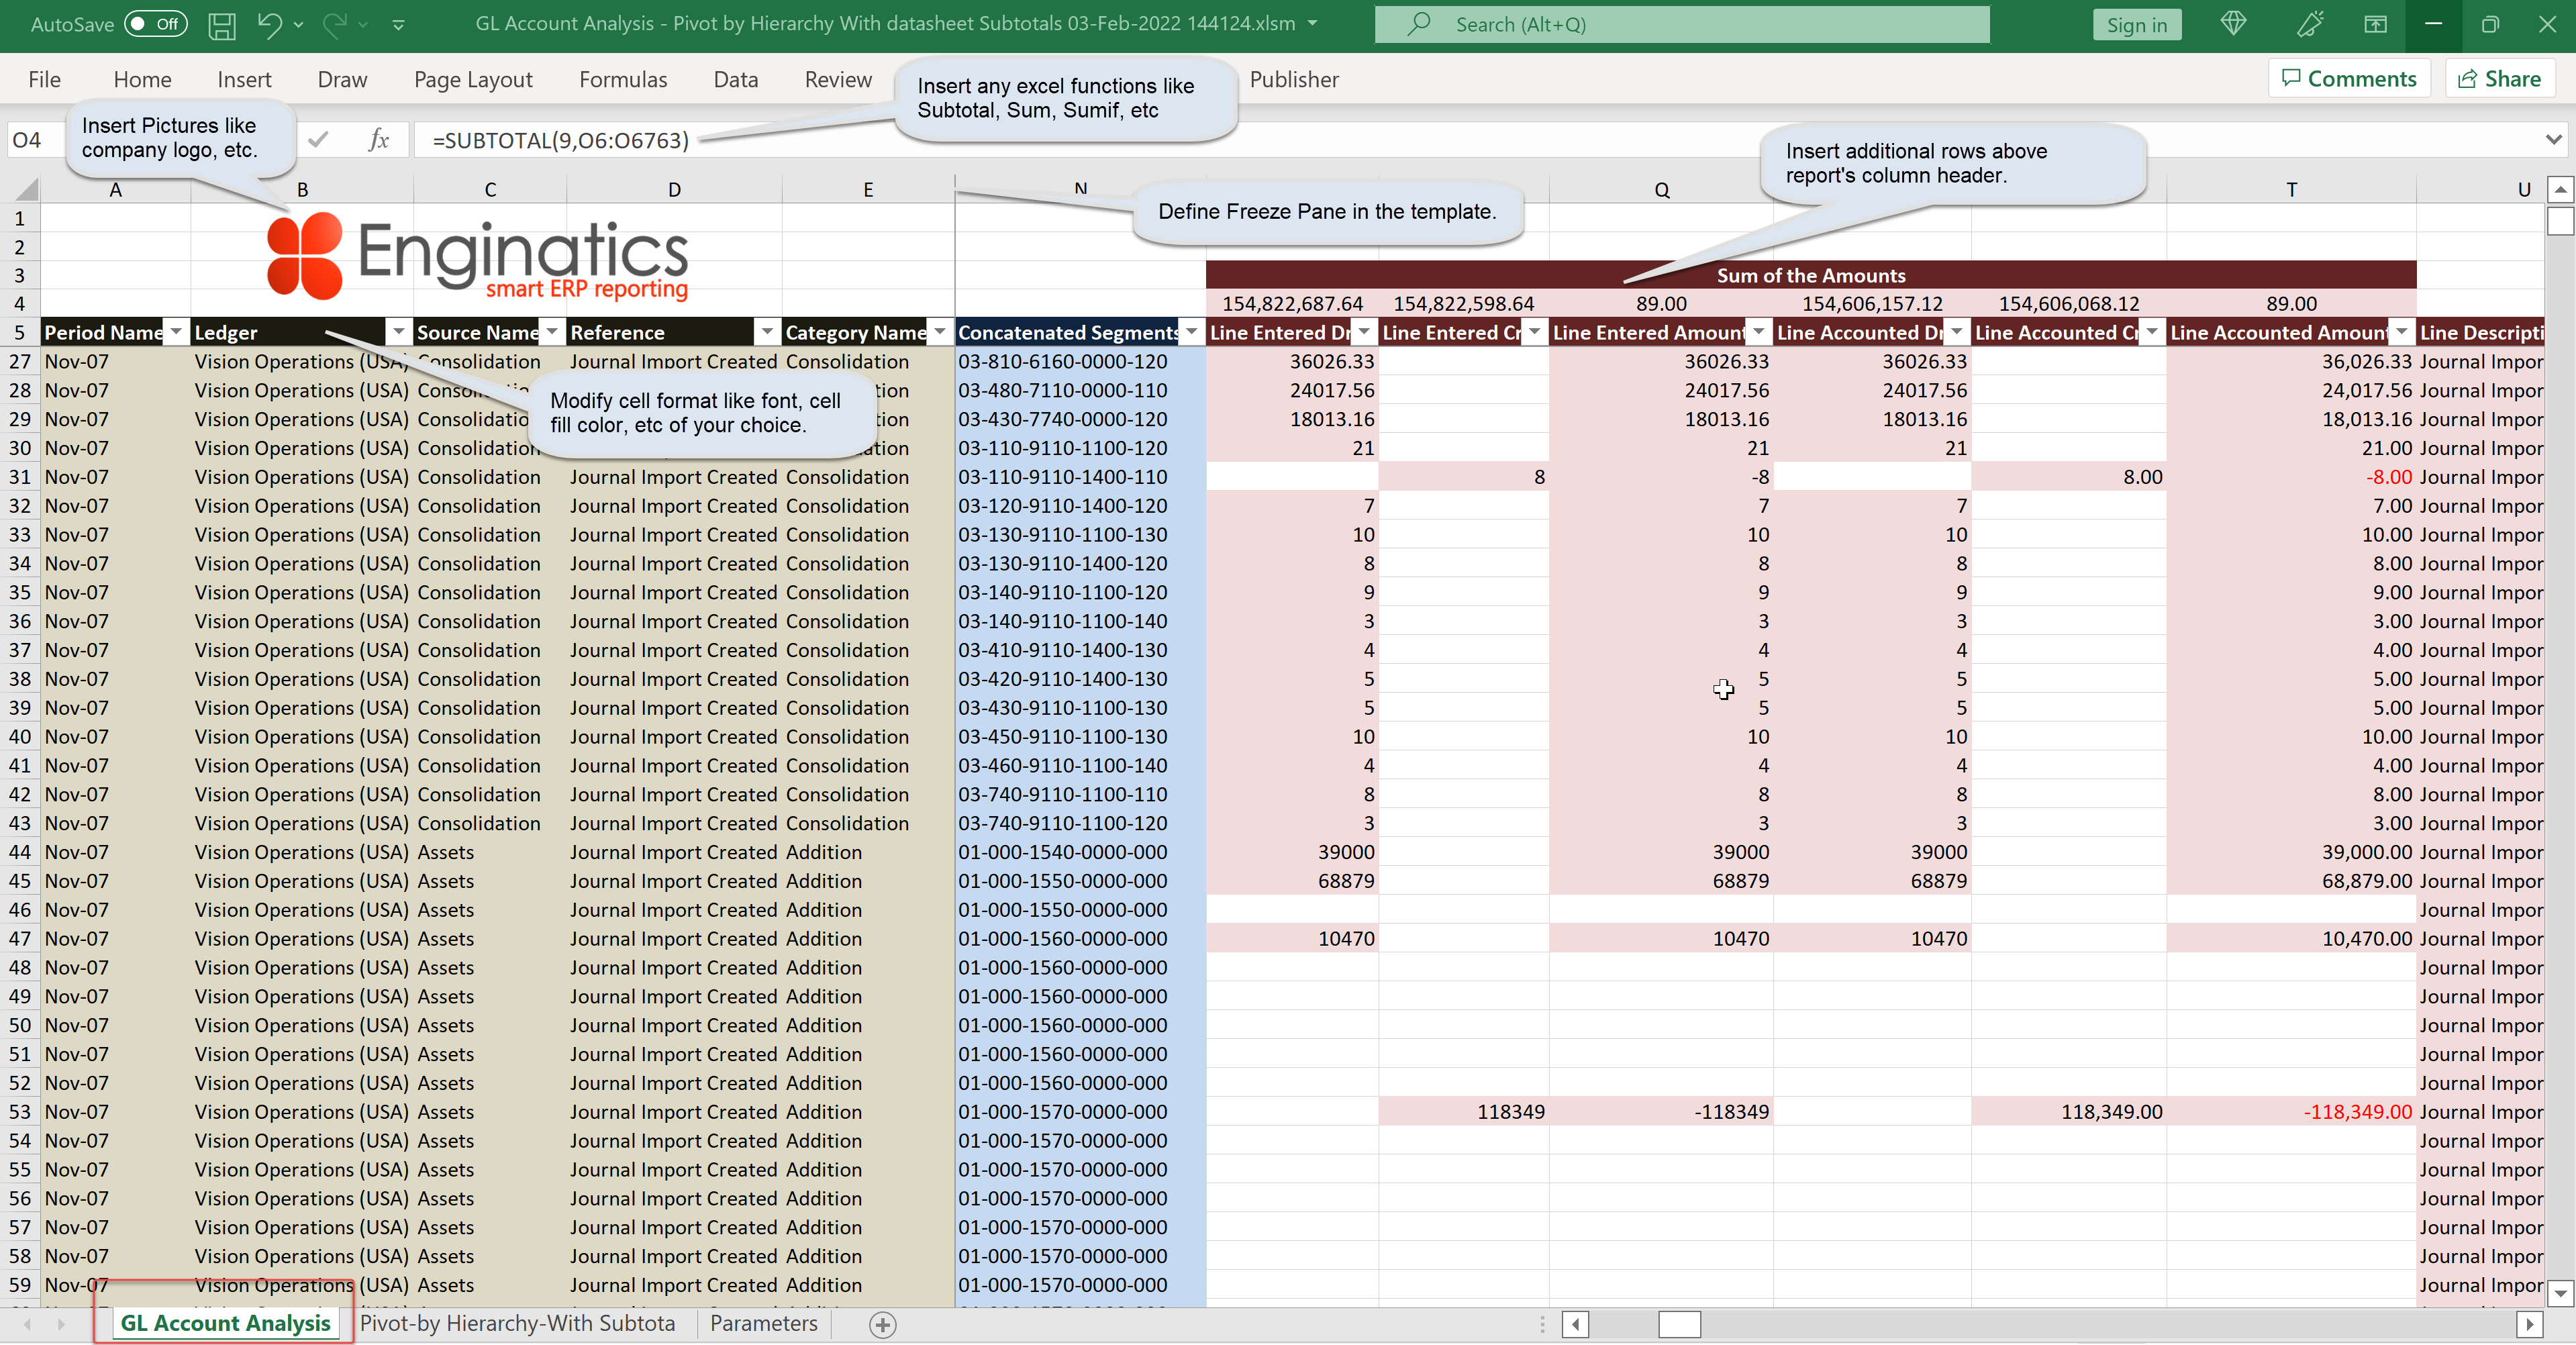
The excel template upload functionality also allows custom template definitions to the datasheet. The excel functions, pictures, screenshots, charts, header footer texts, comments, notes and freeze panes can be defined in the datasheet. To use this feature, execute the following steps :
- Run a report and open the output
- Modify the datasheet based on the required template. Examples provided below
- Datasheet template having
- Pictures like company logo,
- Modified cell format like font, cell fill color, etc,
- Excel functions like Subtotal, Sum, SumIf, etc,
- Additional rows added above the data column header,
- Freeze pane applied
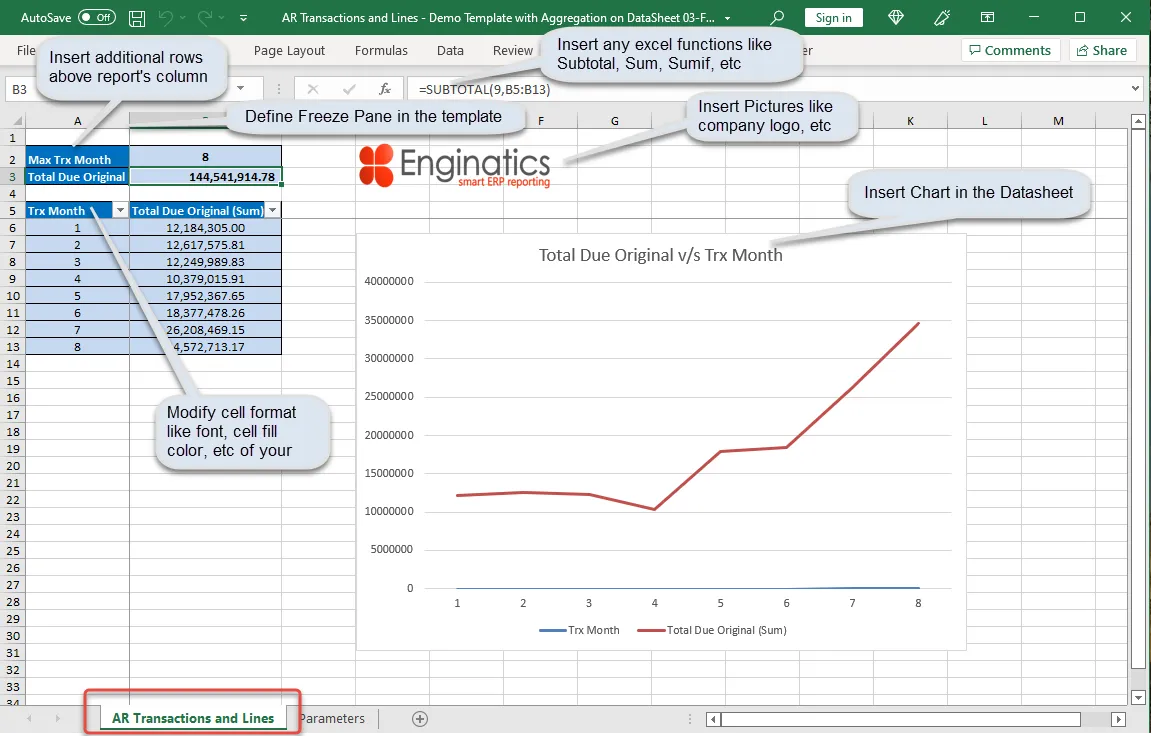
- Datasheet template having
- Datasheet template having
- Line chart,
- Pictures like company logo,
- Modified cell format like font, cell fill color, etc,
- Excel functions like Subtotal, Sum, SumIf, etc,
- Additional rows added above the data column header,
- Freeze pane applied
- Datasheet template having
- Upload the saved Excel file including modifications to the datasheets.
- Run the report again with parameters as required. The output is generated with the uploaded datasheet template having refreshed with new data.
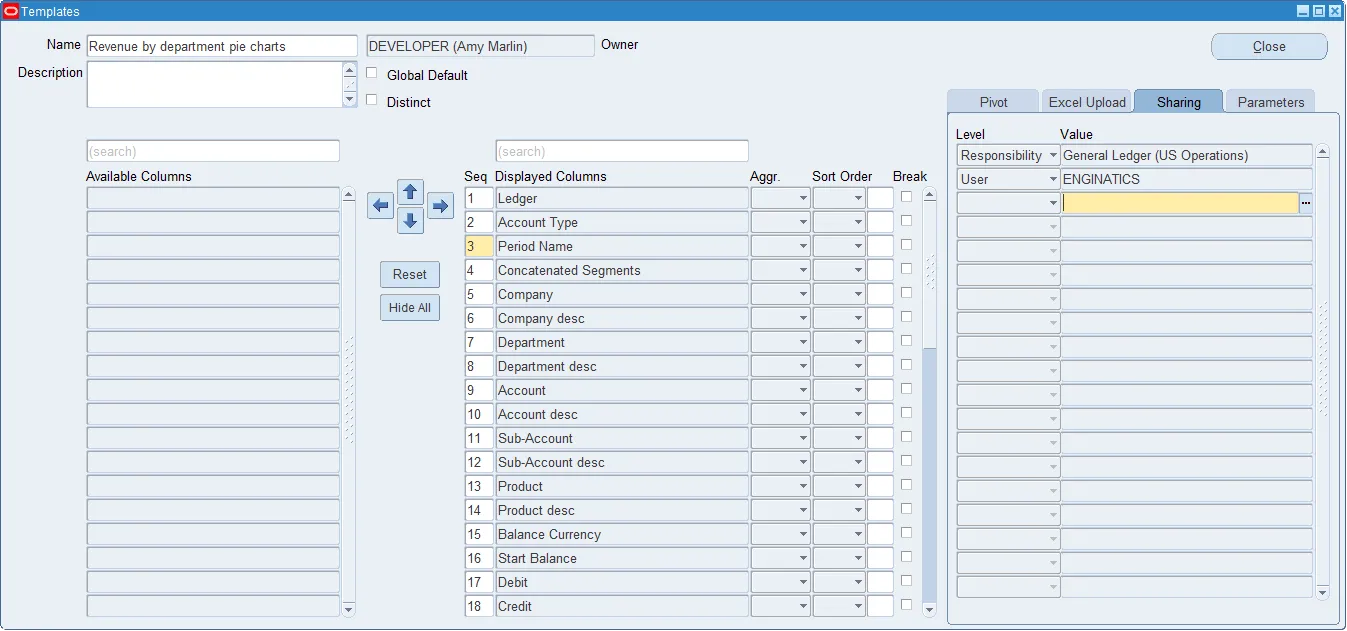
Template sharing
Templates can be shared across the following levels:
- Site: all users in the system
- Responsibility: users having the responsibility
Sharing gives other users access to run a template, but not to modify it. To let a group of users maintain a template together, a responsibility can be set as the template owner instead, see Column template.
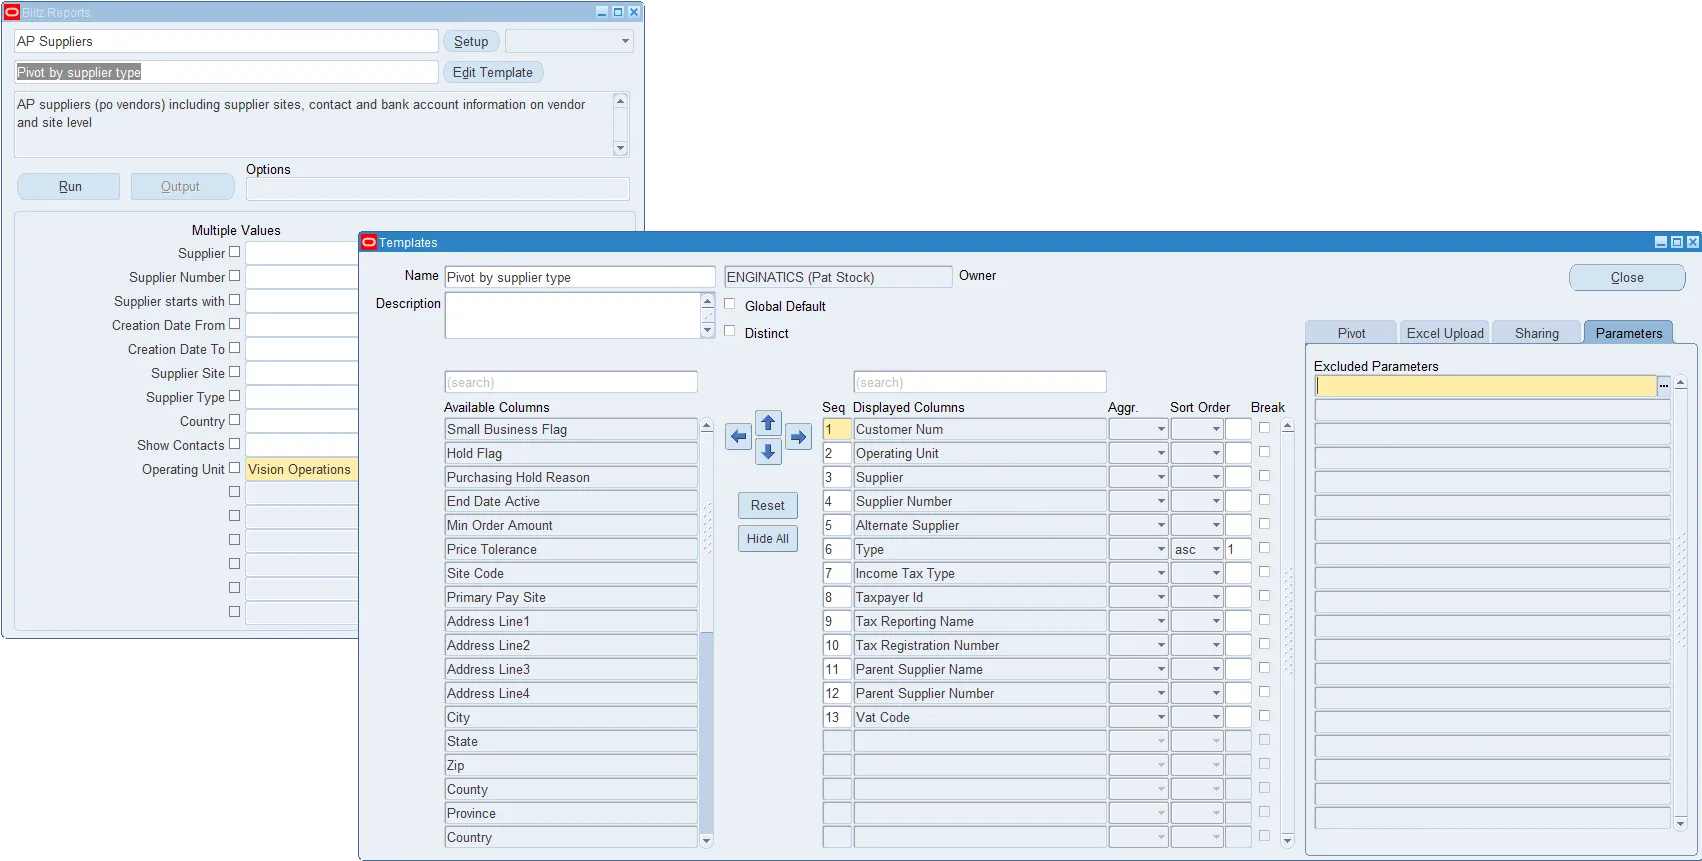
Excluded parameters
You can exclude certain parameters for a template. When the template is selected on the Run window, the excluded parameters are not displayed. The followings screenshots provide an example:
1.6 Scheduling a report
Blitz Reports can be scheduled as background processes to run at a certain date or time. This feature can be used to run time-consuming reports during non-office hours, or to automatically distribute files by email or place them into a folder on the file system. There is a training video available on scheduling and output file distribution.
The easiest way to schedule a report is to run the Blitz Report first, and to then copy the submitted concurrent request and schedule it:
- Run a report from the Blitz Report run window with parameter restrictions as required
- Navigate to the menu > view > requests > submit a new request > single request > Copy > Find > select the concurrent request submitted in step 1
- Update schedule and delivery options as required and re-submit the request
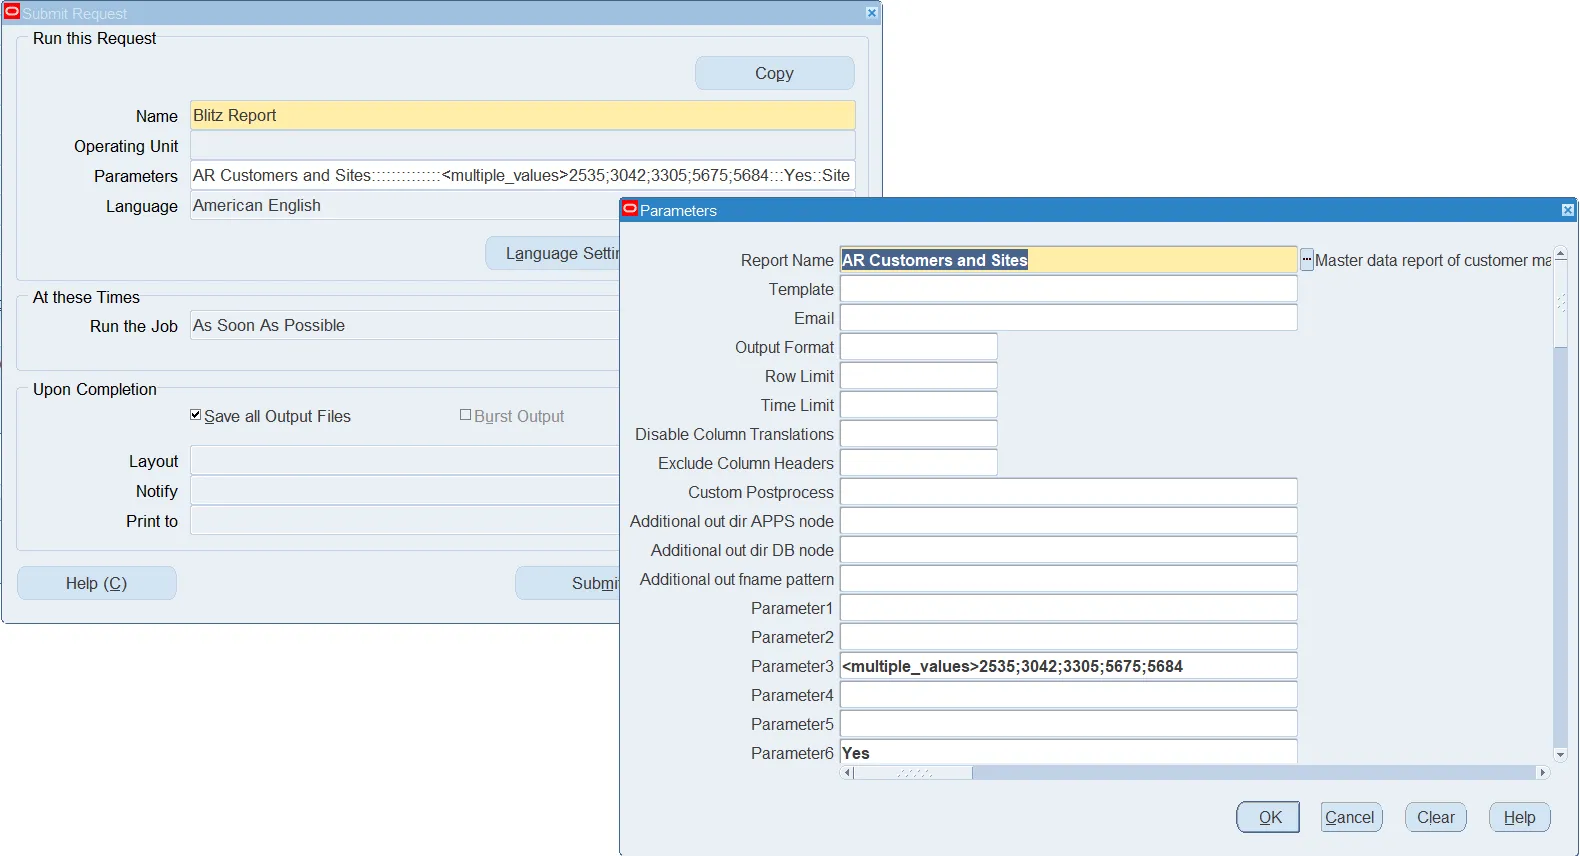
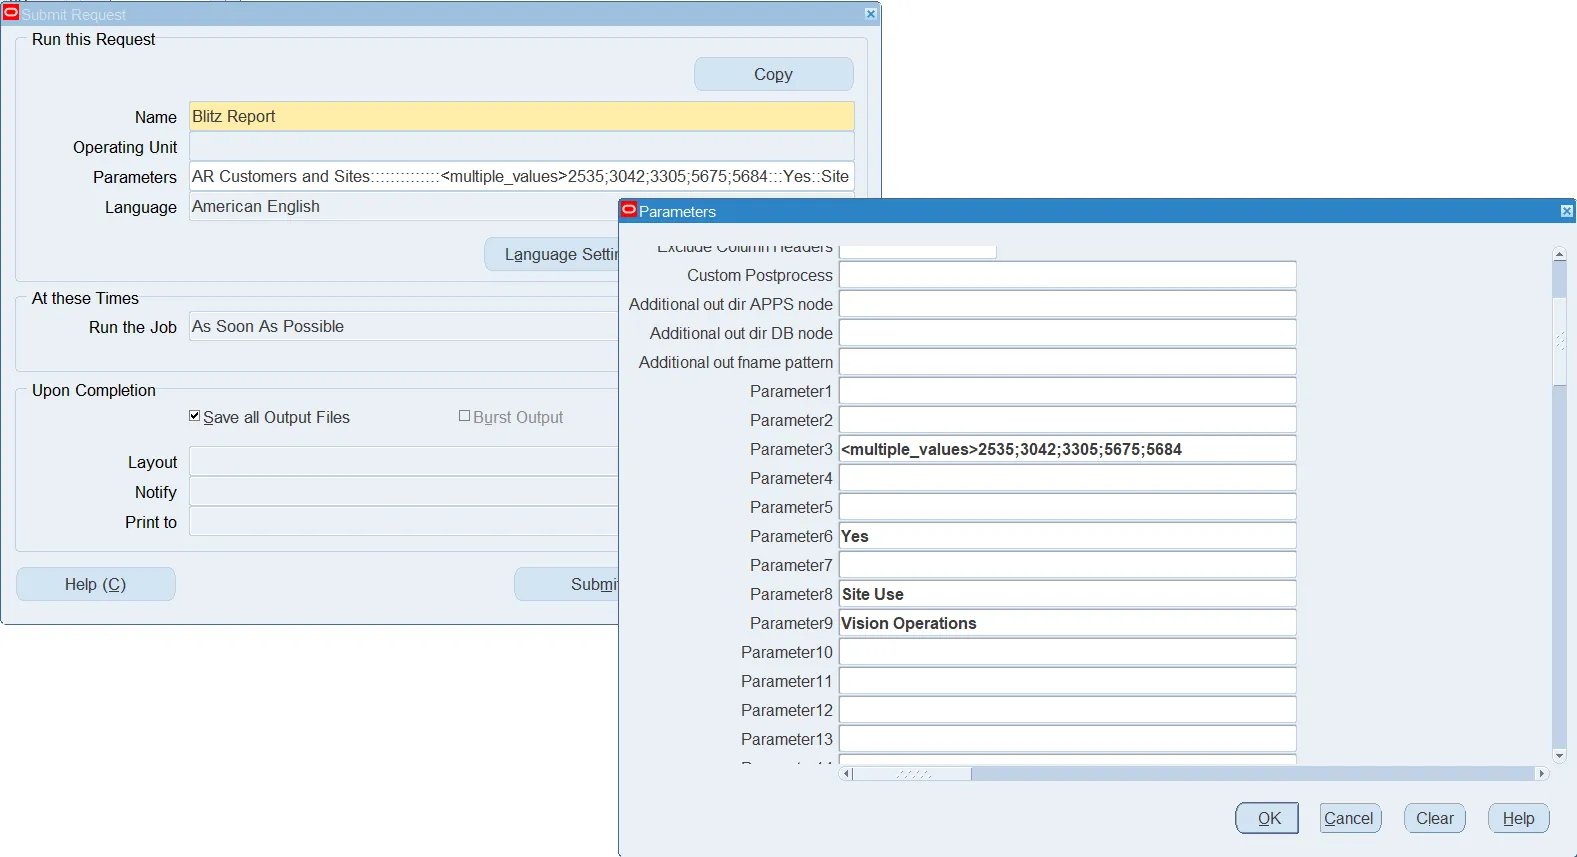
Alternatively, you can submit a new ‘Blitz Report’ concurrent request, populating its parameters manually. Select the required report name from the LOV and populate parameters 1 to 87 with values in exactly the same order as they appear on the Blitz Report run window. For example, if the third parameter is ‘Operating Unit’ with a value of ‘Vision Operations’, then Parameter3 of the concurrent request would need to be populated with this value in order to filter the report data by operating unit.
A multiple values string can be entered by using the keyword (see below).
To schedule the report ‘Customer Sites’ and extract the data as shown in the previous example, concurrent request parameters would need to be entered as follows.
Delivery options and output distribution
Oracle’s delivery options allow sending the report output e.g. as an email attachment, to an FTP location or uploading it to a WebDAV cloud storage.
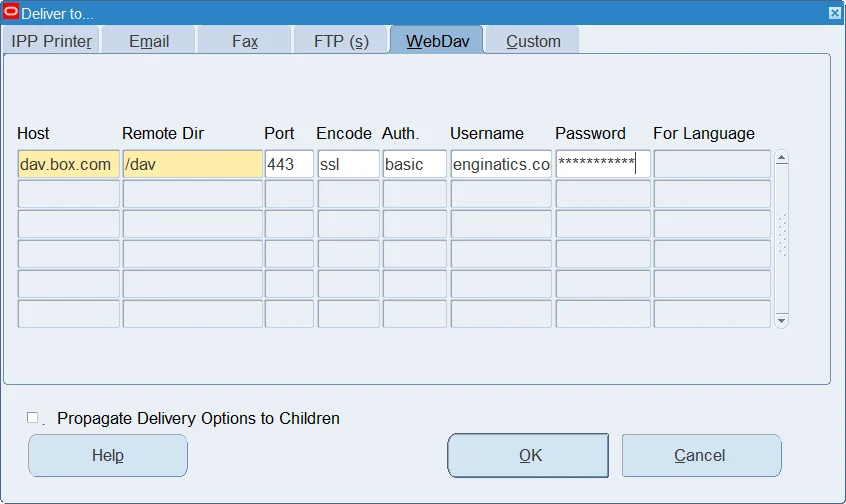
If a scheduled report does not retrieve any data, Blitz Report does not send an empty output file. In case you also want to send empty output files for scheduled reports, set Blitz Report Suppress Empty File Delivery to ‘No’.
2 GL Financial Statement and Drilldown (FSG)
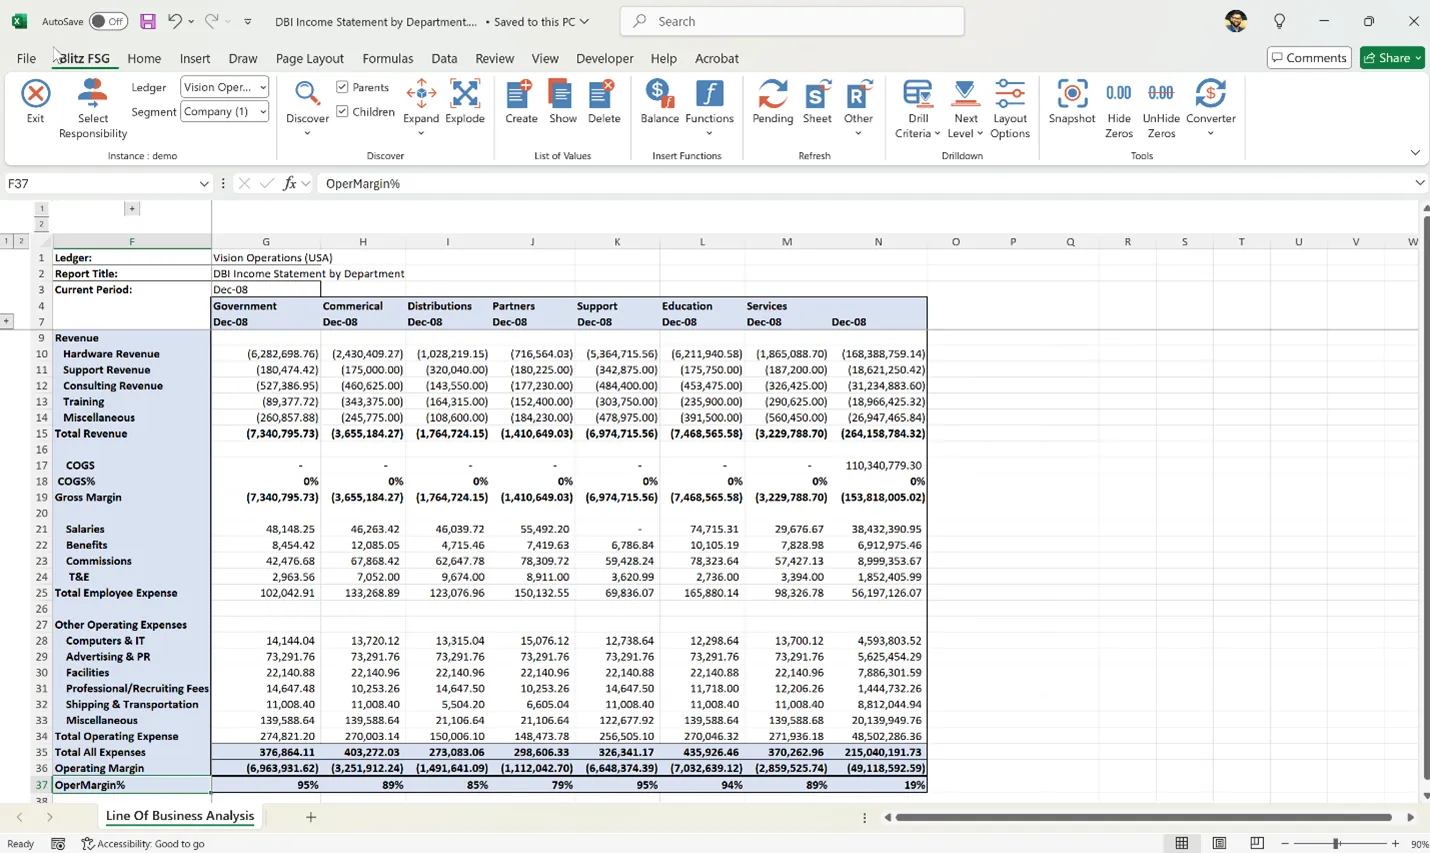
The GL Financial Statement and Drilldown (FSG) Report empowers users to generate comprehensive reports on financial balances while providing detailed insights through drilldown capabilities. This tool allows users to link Excel cells directly to Oracle data via built-in functions, ensuring that data can be refreshed as needed to reflect the most up-to-date information.
Key features include:
- Balance and Detail Reporting: Generate high-level balance reports and drill down into the details, including journal entries and subledger transactions.
- Oracle Data Integration: Seamlessly link Excel cells to Oracle data, with the ability to refresh the data for real-time updates.
- Drilldown Functionality: Access detailed information at various levels, including balances, journal entries, and subledger details.
- Migration Tools: Converters are available to migrate reports from Oracle FSG, GL Wand, and Spreadsheet Server to this solution.
For a quick demonstration, refer to our YouTube video: https://youtu.be/dsRWXT2bem8
2.1 Accessing Blitz FSG
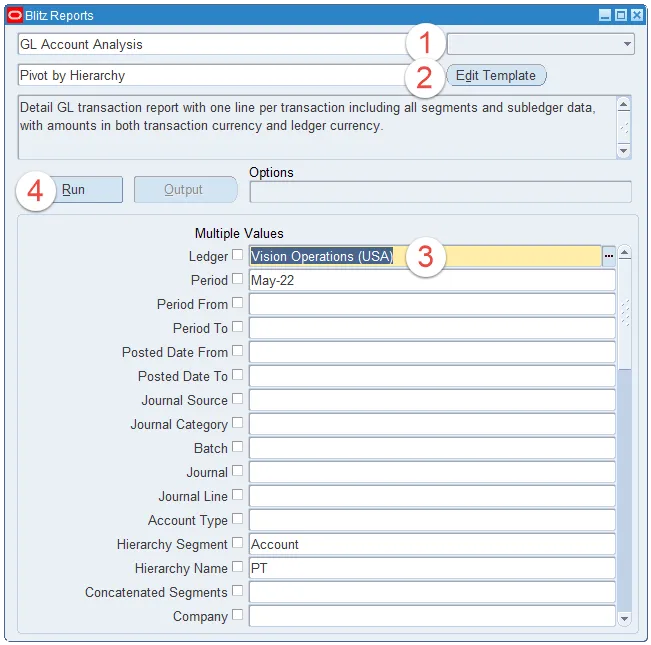
Running the Default GL Financial Statement and Drilldown (FSG) Report in Blitz Report
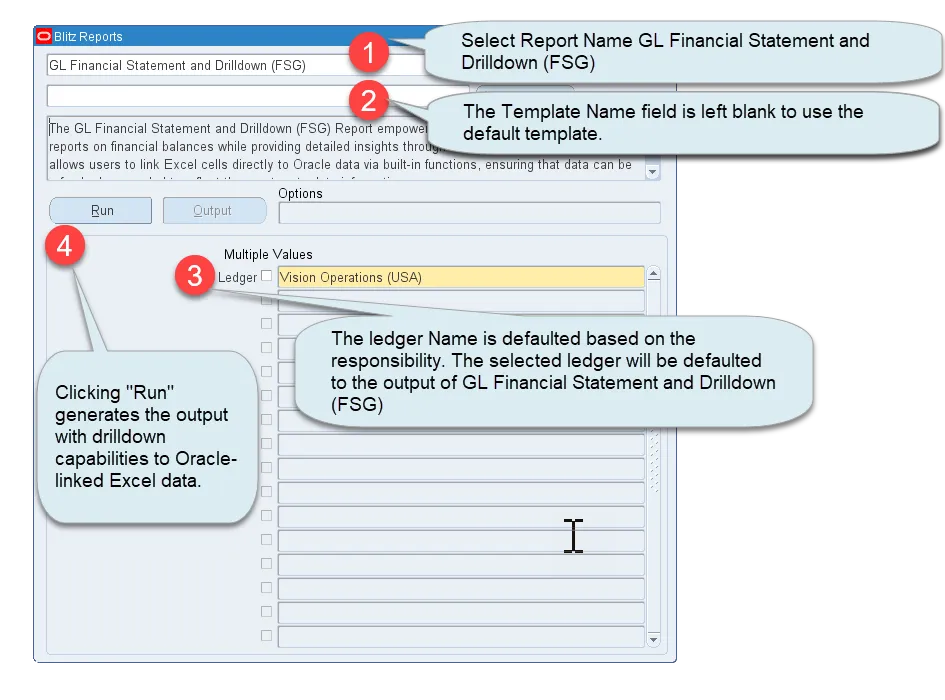
1. Select Report Name GL Financial Statement and Drilldown (FSG).
2. The Template Name field is left blank to use the default template.
3. The ledger Name is defaulted based on the responsibility. The selected ledger will be defaulted to the output of GL Financial Statement and Drilldown (FSG).
4. Clicking “Run” generates the output with drilldown capabilities to Oracle-linked Excel data.
5. Build your templates either by converting from legacy tool or by creating a new template using the tools present in Blitz FSG custom ribbons.
Running the GL Financial Statement and Drilldown (FSG) Report for uploaded templates in Blitz Report
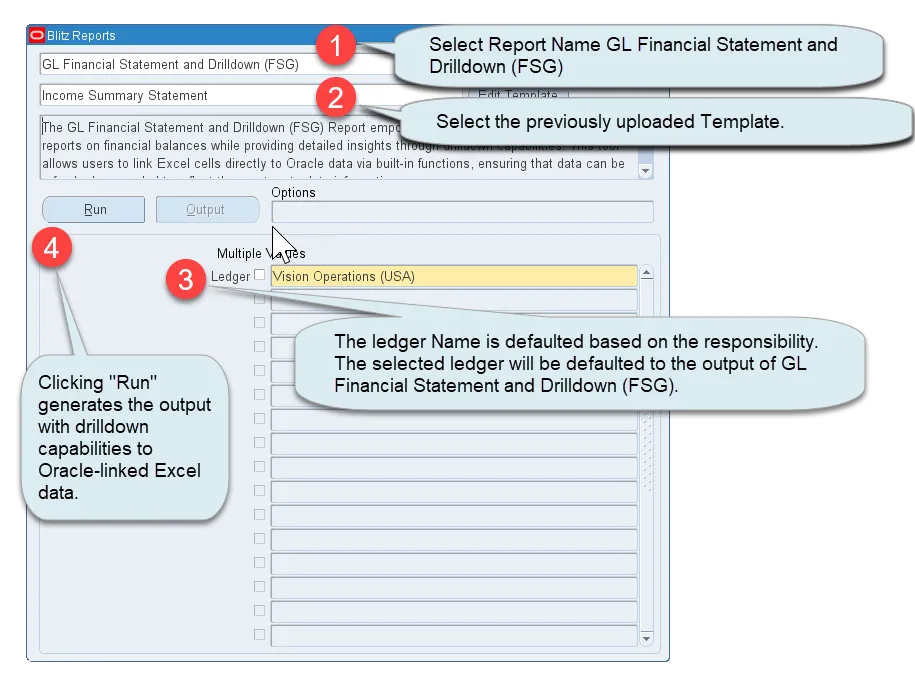
- Select Report Name GL Financial Statement and Drilldown (FSG).
- Select the previously uploaded Template.
- The ledger Name is defaulted based on the responsibility. The selected ledger will be defaulted to the output of GL Financial Statement and Drilldown (FSG).
- Clicking ‘Run’ generates the output with drilldown capabilities to Oracle-linked Excel data.
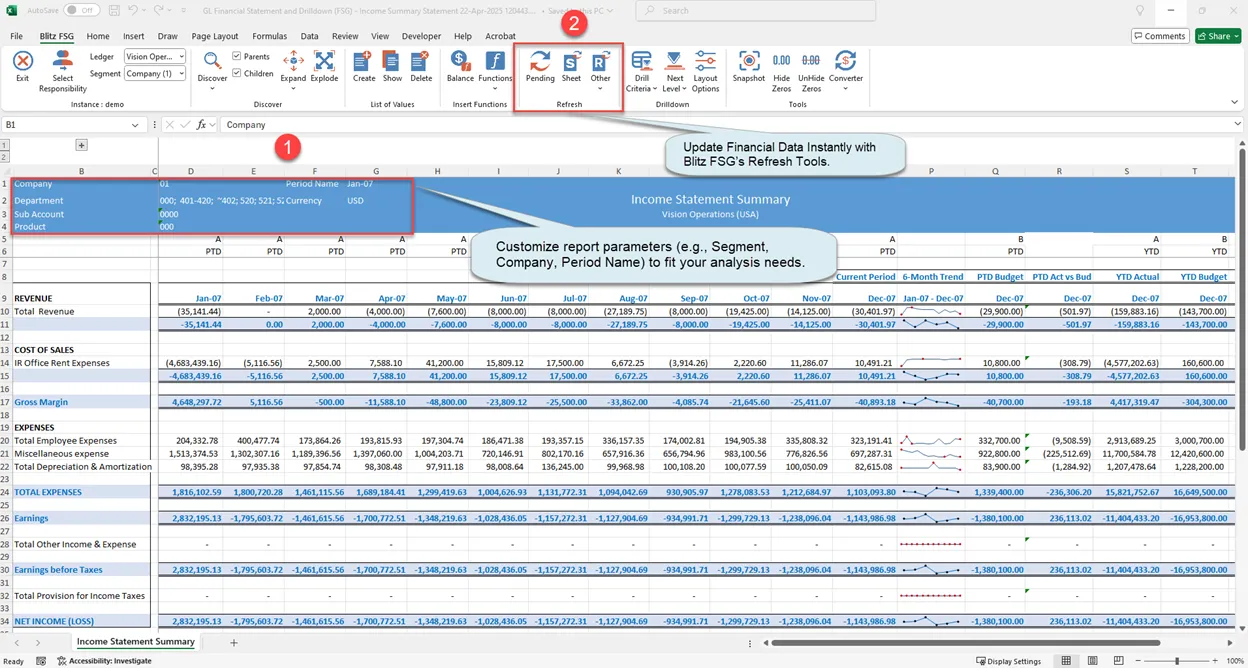
- Customize report parameters (e.g., Segment, Company, Period Name) to fit your analysis needs.
- Update Financial Data Instantly with Blitz FSG’s Refresh Tools.
Running the GL Financial Statement and Drilldown (FSG) Report for templates stored locally
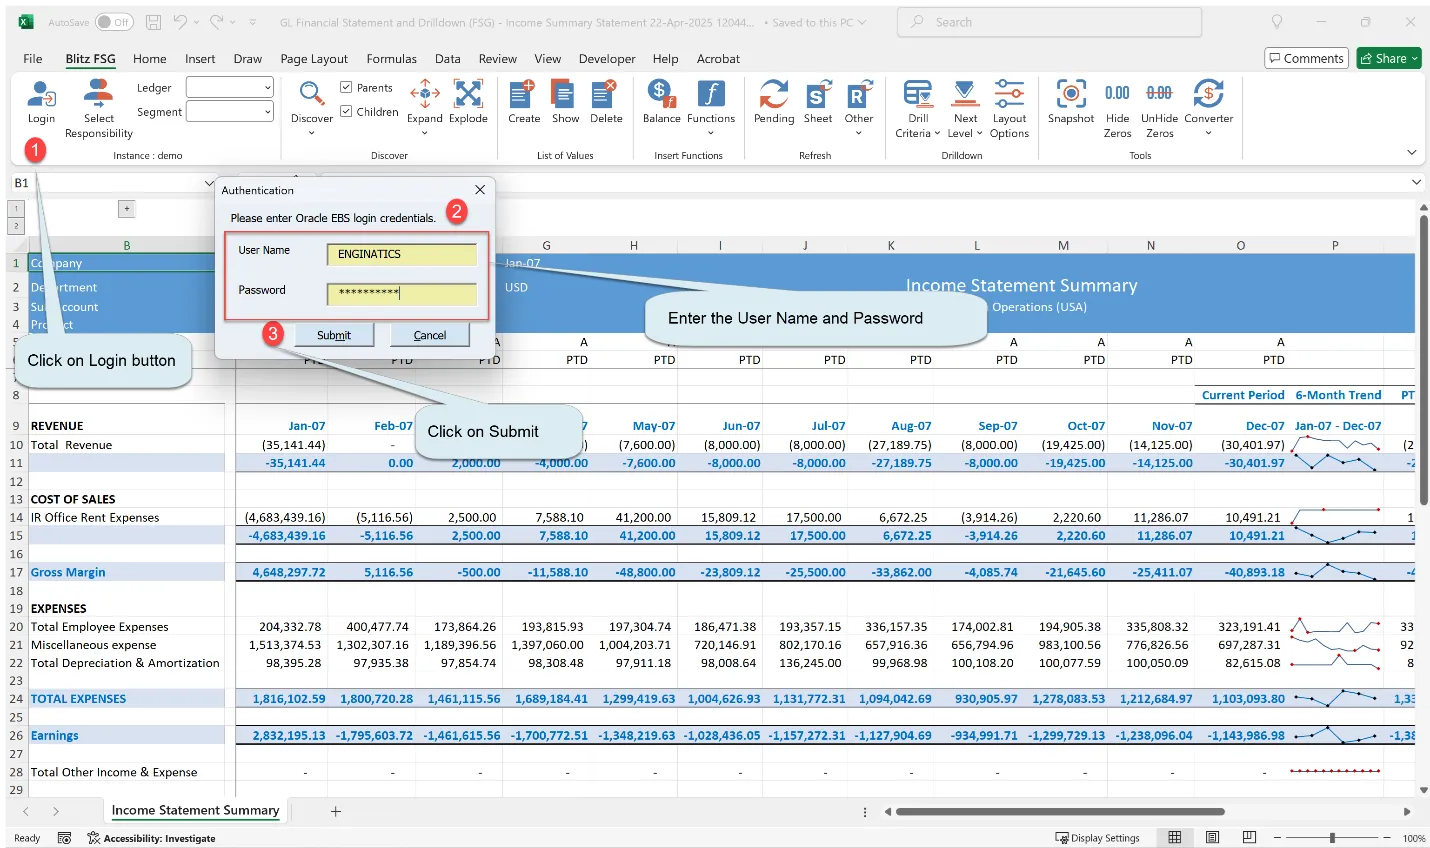
The template can be built and stored locally on your computer or saved to a shared drive for team access. Locate and open the template file.
- Click on Login button
- On the Authentication form:
- Enter the User Name and Password
- Click on Submit
If the Single Sign On is enabled in the organization and the profile ‘Blitz Report SSO Enabled’ is set to ‘Yes’ then the connection is established by Clicking on Login Button.
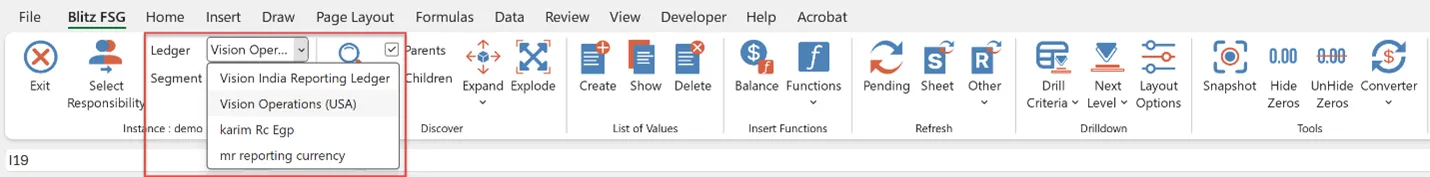
2.2 Responsibility, Ledger and Segment Selector
Once logged in, the Ledger and Segment dropdown menus will populate based on your assigned responsibilities. The responsibility is defaulted with the responsibility from which the report was run.

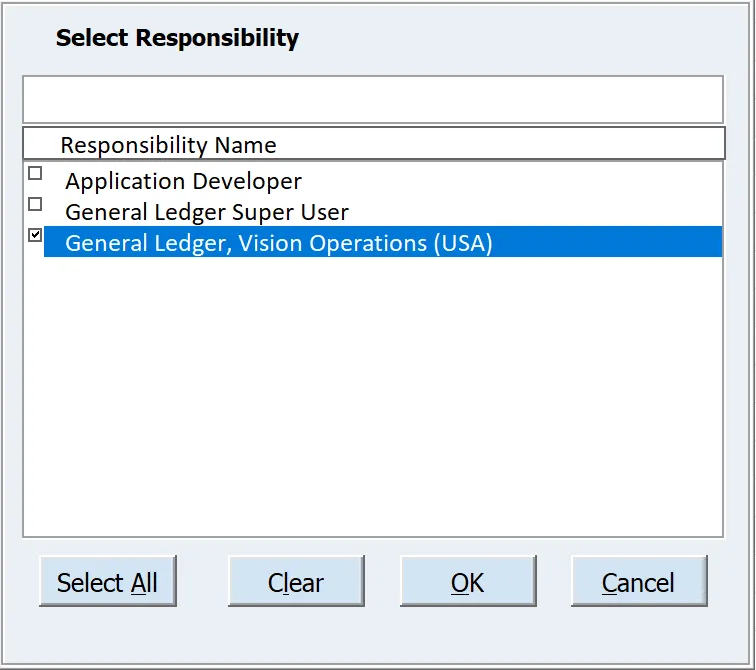
Select Responsibility
The list displays all responsibilities you have access to in Oracle, including those with Account Inquiry functionality. By default, the system selects the responsibility from which the report was launched.
You can:
- Select a different responsibility using the checkboxes
- Choose all responsibilities by clicking the ‘Select All’ button
After making your selection, click OK to load the corresponding ledgers in the dropdown. Your selection will be saved and automatically set as the default for future use.
Ledger
The Ledger dropdown dynamically displays available ledgers according to your access permissions:
- Single Responsibility Access: Shows only ledgers assigned to your current responsibility
- Multiple Responsibilities: Lists all ledgers from all responsibilities you’ve selected
- Oracle R12 Environment: If selected responsibility’s data access set contains multiple ledgers, all will appear.
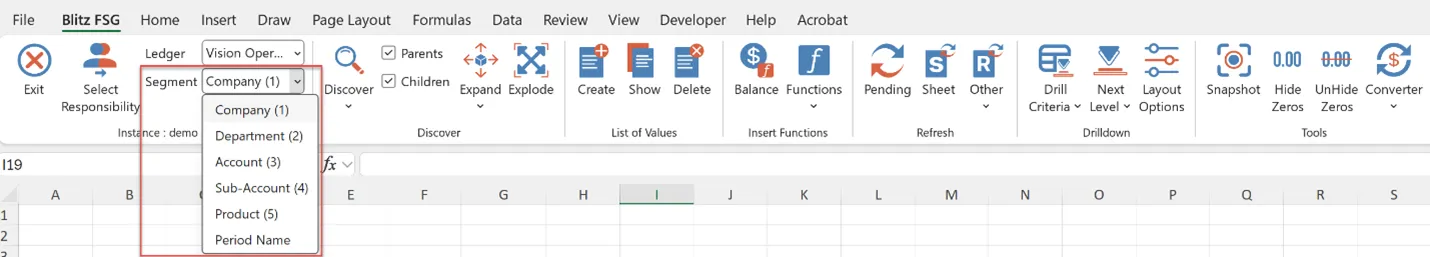
Segment
The dropdown list displays all available segments for the currently selected ledger. Each segment is labeled with its corresponding segment number in parentheses (e.g., ‘Company (1)’). It also contains the special ‘Period’ value for period name discovery.
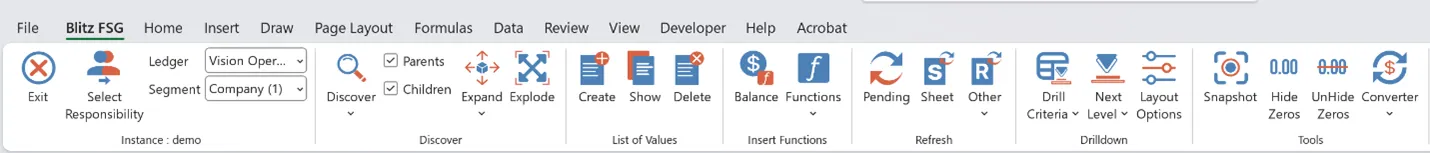
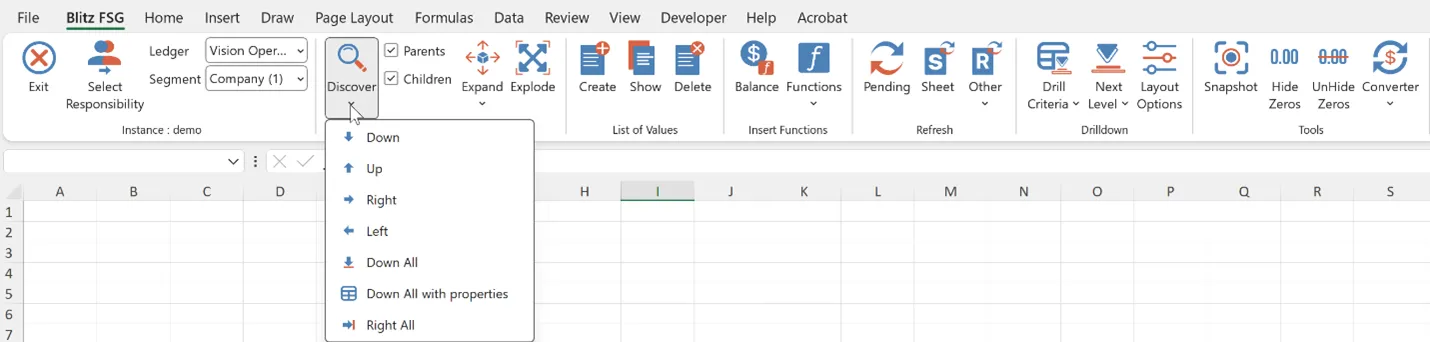
2.3 Discover
The Discover Tools enable you to:
- Extract segment information directly from Oracle
- Automatically populate Excel cells with the retrieved data

Discover
This feature enables you to:
- Populate Excel spreadsheets directly with chart of accounts values and period name.
- Streamline report building and segment value review processes
Key Features:
- Automatic population of adjacent cells (down or to the right)
- Configurable hierarchy discovery:
- Child values only
- Parent values only
(Adjust via Discover Level setting check the box to decide the level)
| Down | Discover Down value for the currently selected segment or period. |
| Up | Discover the previous value Up for the currently selected segment or period. |
| Right | Discover the next value to the Right for the currently selected segment or period. |
| Left | Discover the previous value to the Left for the currently selected segment or period. |
| Down All | Discover All segment values Down for the currently selected segment. |
| Down All with properties | Down All with properties allows a variety of information to be extracted about the selected segment values. The following information will be populated in the cells to the right of the segment value:
|
| Right All | Discover All segment values to the Right for the currently selected segment. |
Discover Functionality Best Practices:
- Segment Matching
Ensure the segment selected in the Ledger and Segment Selector matches the segment in your active Excel cell. - Parent Values Identification
- Parent values appear in bold font
- Regular font indicates child values
- Batch Discovery. To discover multiple values simultaneously:
- Highlight a range of cells
- Click any discover button
- Complete Value Discovery. For all available values:
- Use Discover Down All (vertical)
- Or Discover Right All (horizontal)
- Text Format Requirement. All segment values must be in text format to preserve formatting:
- Option 1: Pre-format cells as Text (Number Format > Text)
- Option 2: Prefix values with an apostrophe (‘)
- Example: For “001”, enter ‘001
- Note: Without this, leading zeros will be lost and discovery may fail
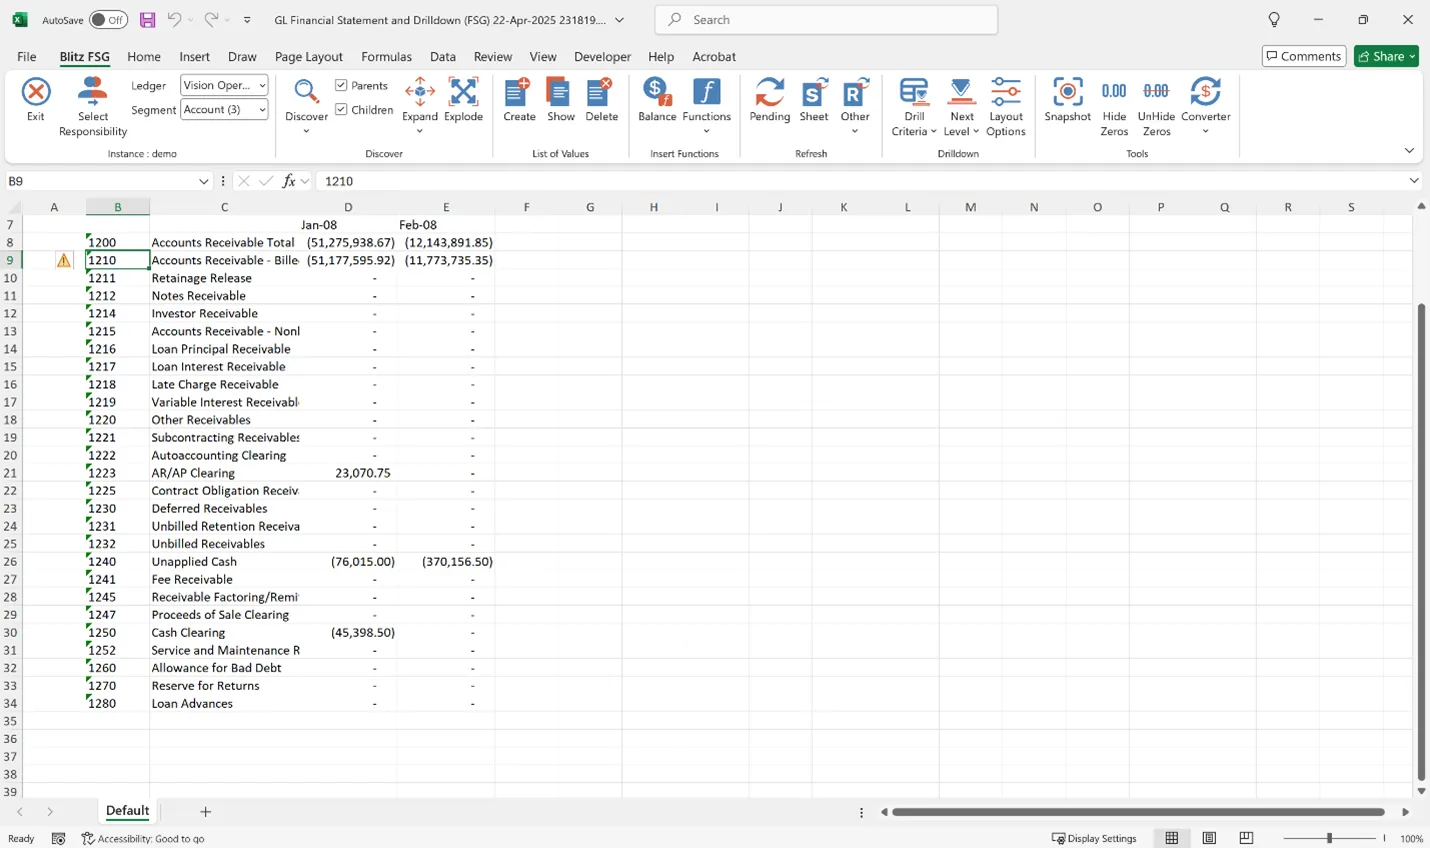
Expand
To expand to child segment values:
- Select a cell containing a parent segment (e.g., ‘Account(3)’) value
- Ensure adjacent columns contain related Blitz FSG functions (segment description, balance, etc.)
- Click ‘Expand > Down’ to reveal all child values in the hierarchy”
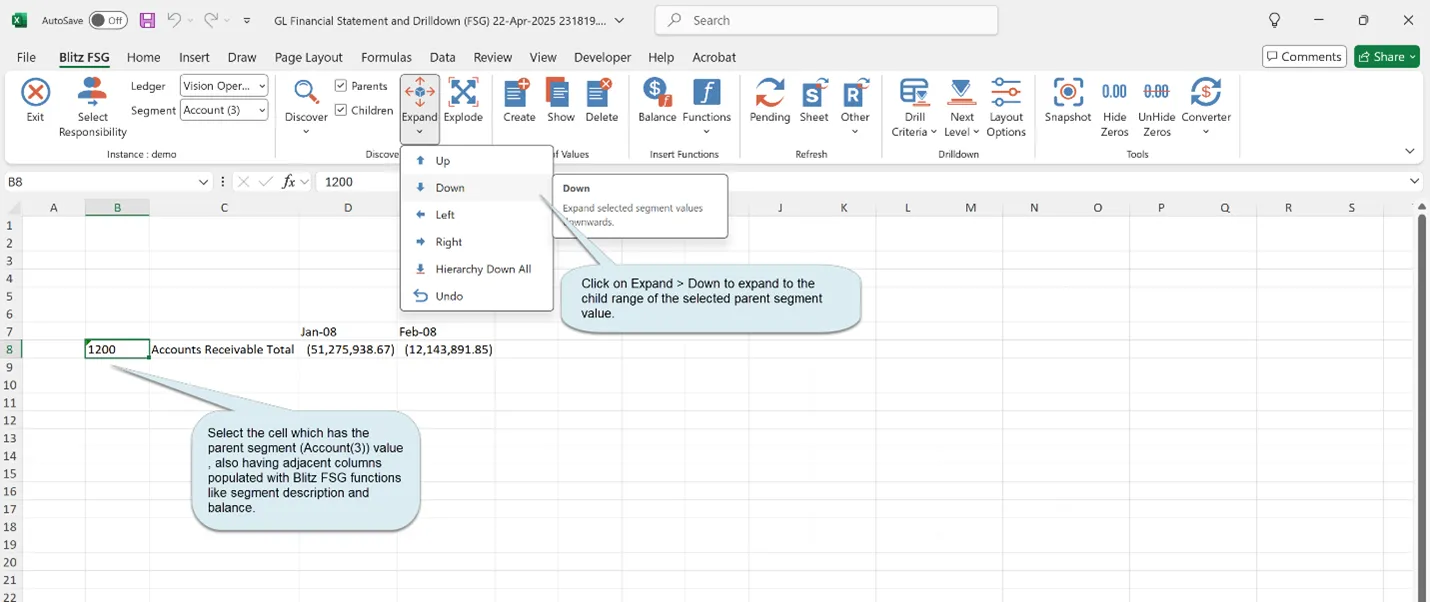
When expanded, the child values will be inserted while automatically copying all adjacent formulas and content to the new rows.
Multi-Row Expand Option
You can select multiple rows before executing an Expand operation. Blitz FSG will automatically expand each selected row individually.
Undo
Clicking Undo Expand removes the results of the most recent Expand operation.
- Supports multiple undo levels.
- Repeated clicks will step backward through previous Expand results.
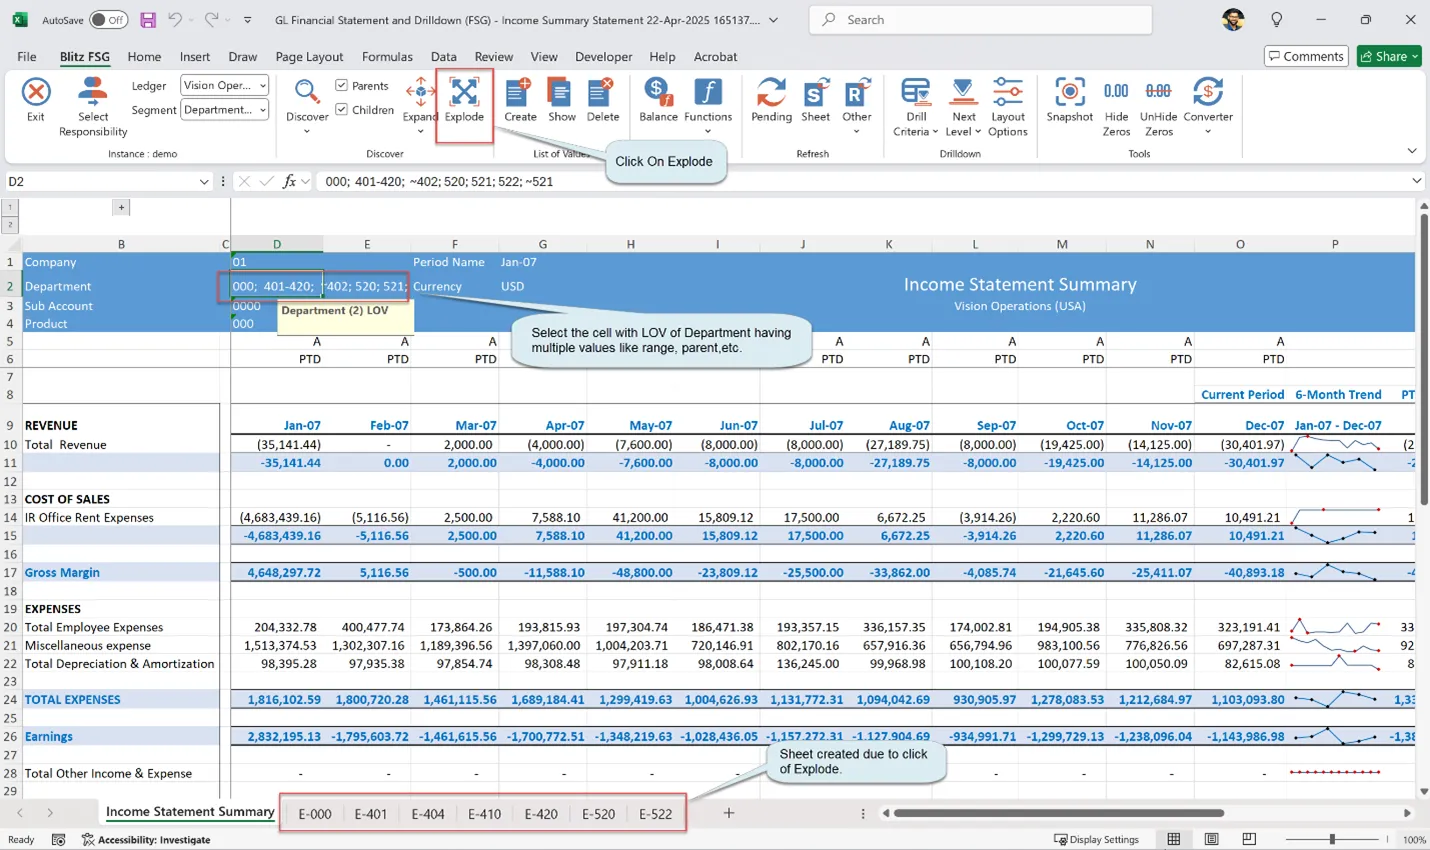
Explode
The Explode feature duplicates the current worksheet for each child value of your selection. Your selection can be:
- Parent segment value
- Segment Value range
- Child segment Value
- Any combination of these
- Select a cell containing a segment value (e.g., a parent account)
- Choose the corresponding segment from the list (e.g., “Department”)
- On Click of Explode button, Blitz FSG will –
- Retrieve all child values from Oracle
- And create a new worksheet for each child value in the current workbook

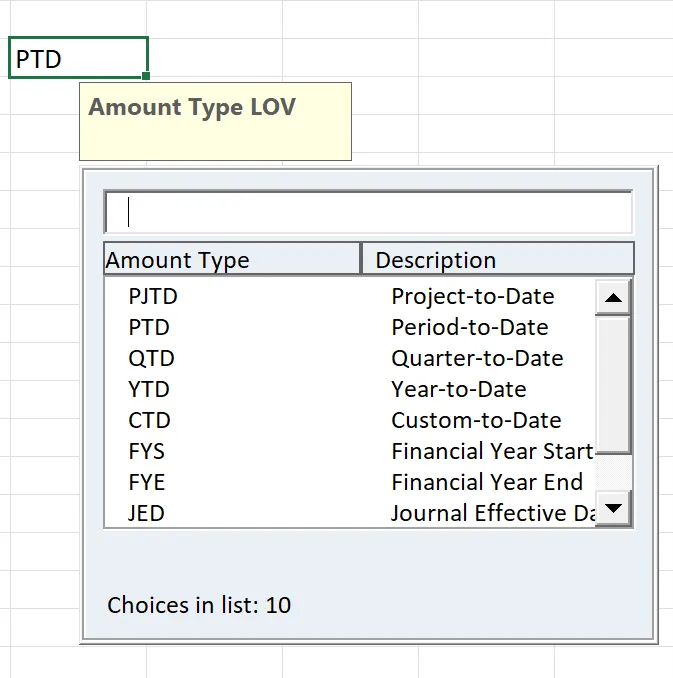
The ‘Create’ feature converts a cell into a List of Values (LOV) cell, marked by a note prefixed with the LOV name (e.g., ‘Amount Type LOV’, ‘Company (1) LOV’).
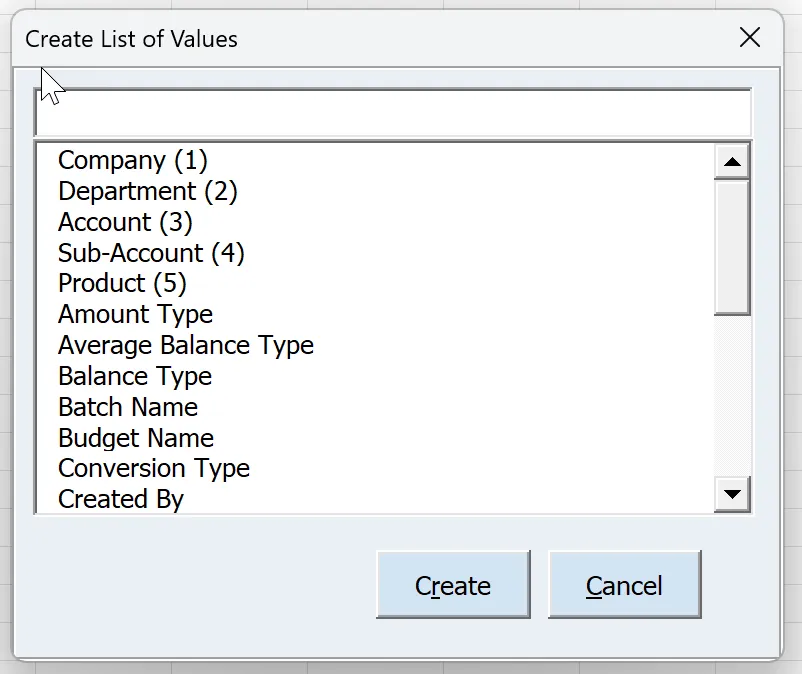
To access the values:
- Double-click the cell, or
- Select the cell and click ‘Show’ from List of Values on the ribbon.
The LOV will display values specific to the data type assigned to that LOV cell.
There are 3 different types of List of Values:
Single Value
- Refine selections using the search field or select from the list.
- Click OK to apply selections to the cell.
Multiple Value
- Select values individually or use Add Range for bulk inclusion.
- Exclude specific entries with Add Exclude.
- Refine selections using the search field.
- Click OK to apply selections to the cell.
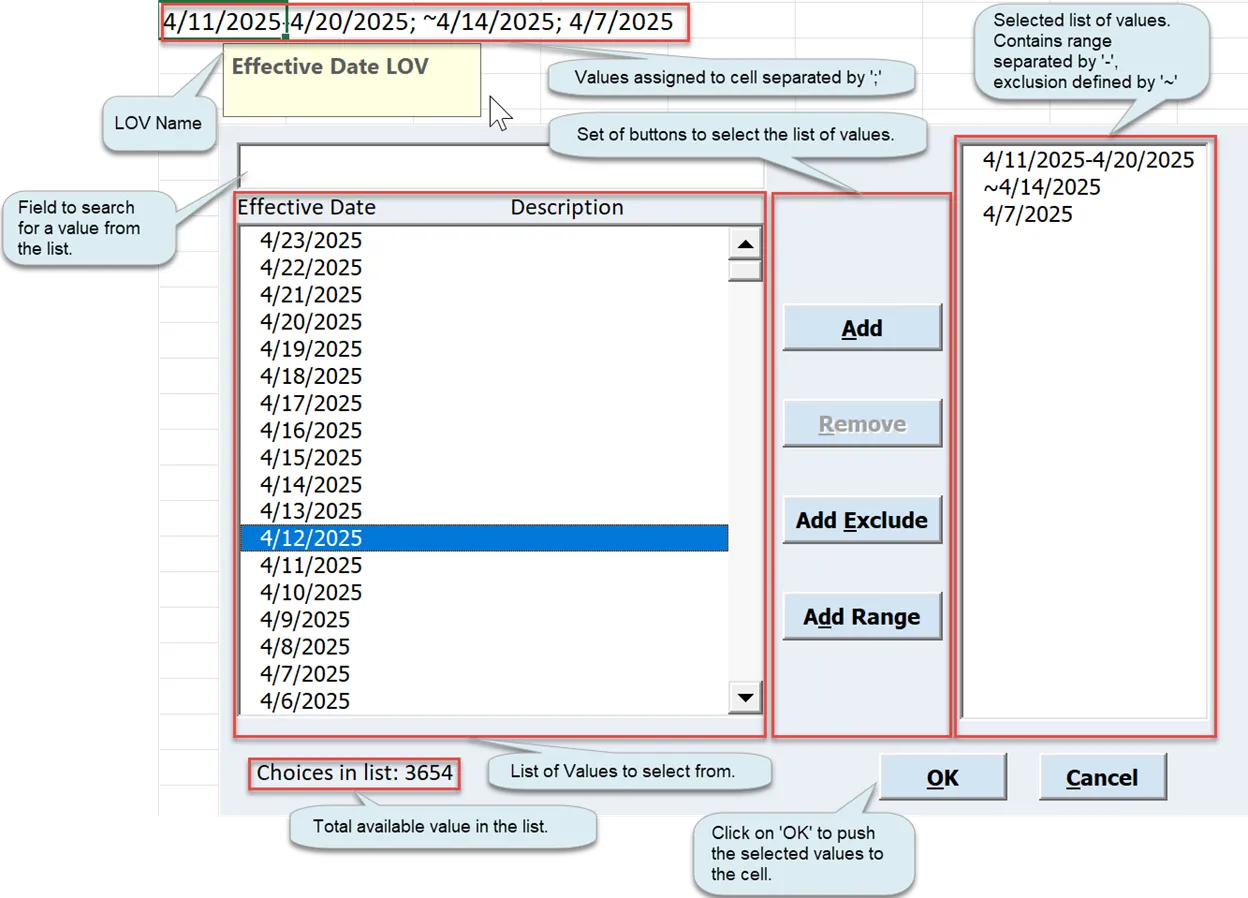
Note: The format rules are as followed:
- Range: Defined with a hyphen (-).
Example: 4/11/2025-4/20/2025 - Exclusion: Prefix with a tilde (~). Applies to single values or
Examples:- Single: ~4/14/2025
- Range: ~4/11/2025-4/20/2025
- Multiple Values on the cells: Separated by semicolons (;).
Example: 4/11/2025; 4/20/2025
Segment Values
The Segment List of Values (LOV) enables selecting account ranges or individual values. It supports hierarchical navigation, multi-selection, and exclusions.
- You could select a hierarchy (e.g., Cash and Short Term Equivalents) to narrow the account list.
- Select values individually or use Add Range for bulk inclusion.
- Exclude specific entries with Add Exclude.
- Refine selections using the search field.
- Click OK to apply selections to the cell.
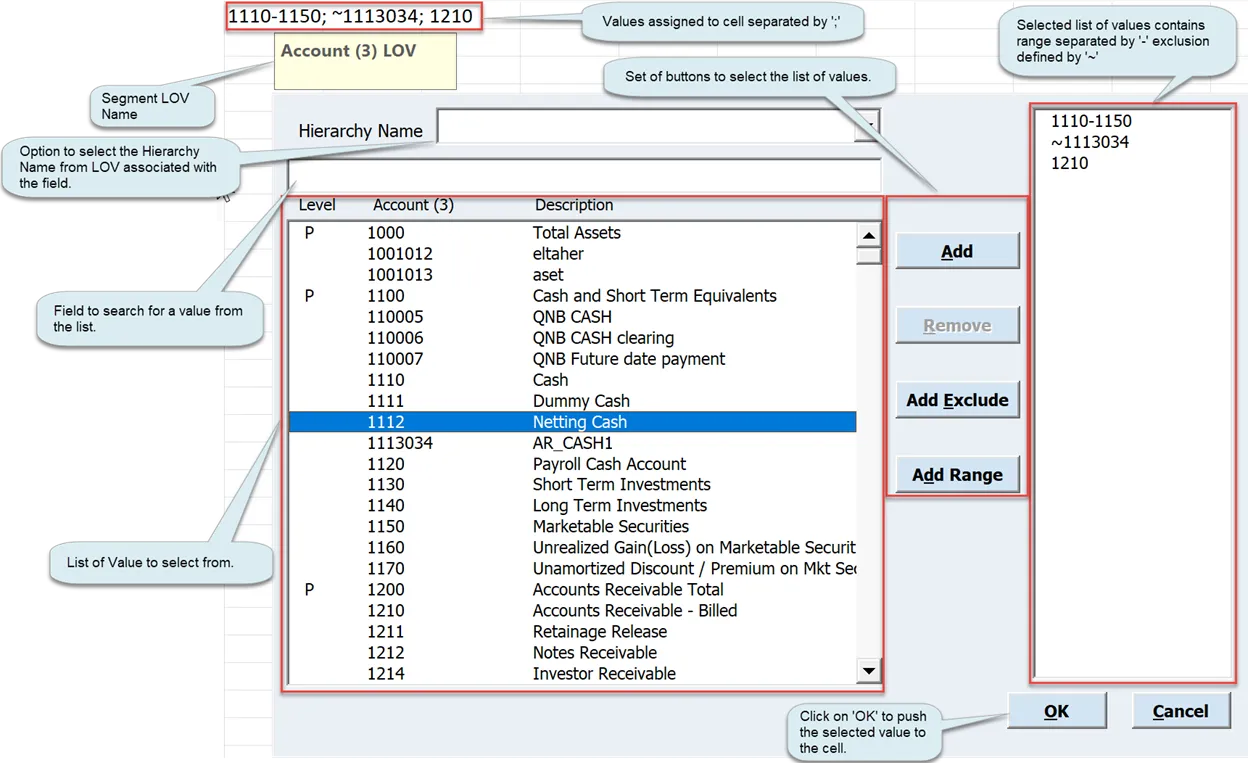
Note: The format rules are as followed:
- Range: Defined with a hyphen (-).
Example: 1110-1150 - Exclusion: Prefix with a tilde (~). Applies to single values or
Examples:- Single: ~1113034
- Range: ~1110-1120
- Multiple Values on the cells: Separated by semicolons (;).
Example: 1110-1150;1210;1211;~1111;~1120-1130
Adding Range in Multiple Values and Segment List of Values
1. First select multiple values from the list, then click ‘Add Range’ to form your chosen value range.
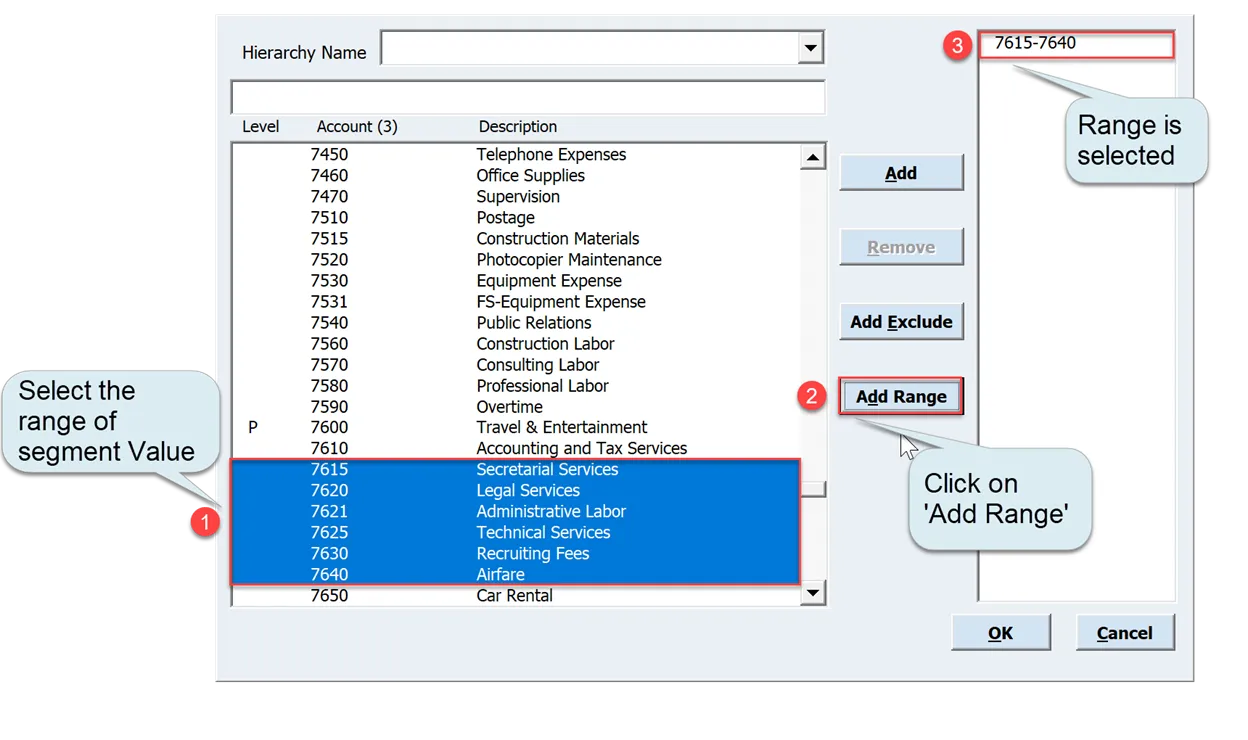
2. First select multiple values from the list, then click ‘Add Range’ to form your chosen value range.
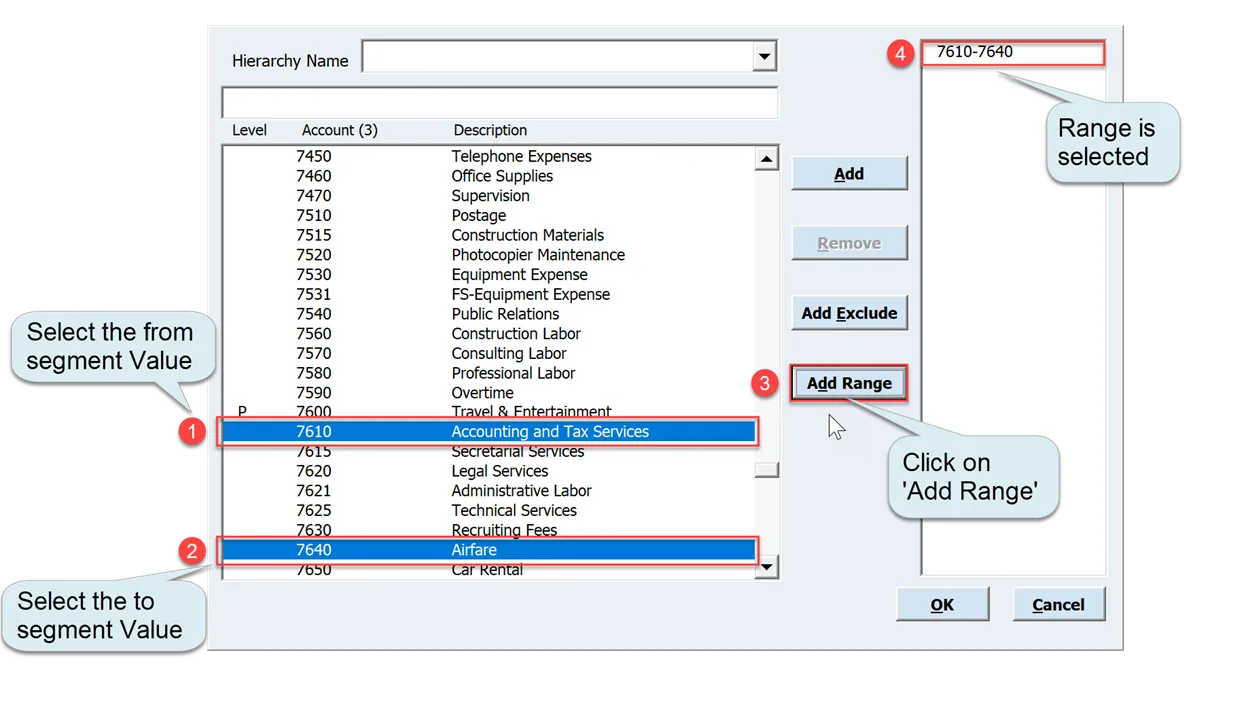
3. Select and ‘Add’ the from value, then the to value, click on selected value and finally click on ‘Add Range’ to form your chosen value range.
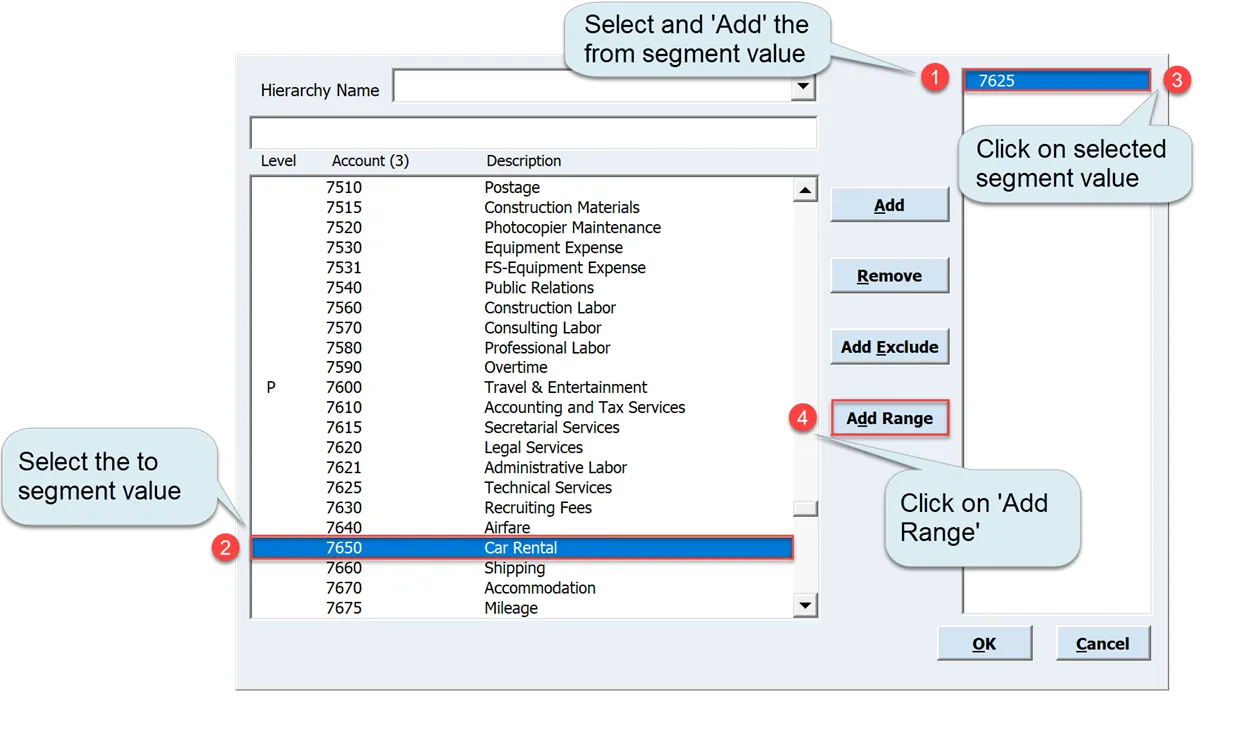
4. Select and ‘Add Exclude’ the from value, then the to value, click on selected value and finally click on ‘Add Range’ to form your chosen value range.

Delete List of Values
To delete the list of values from the cell then you can click on ‘Delete’ from List of Values on the ribbon.
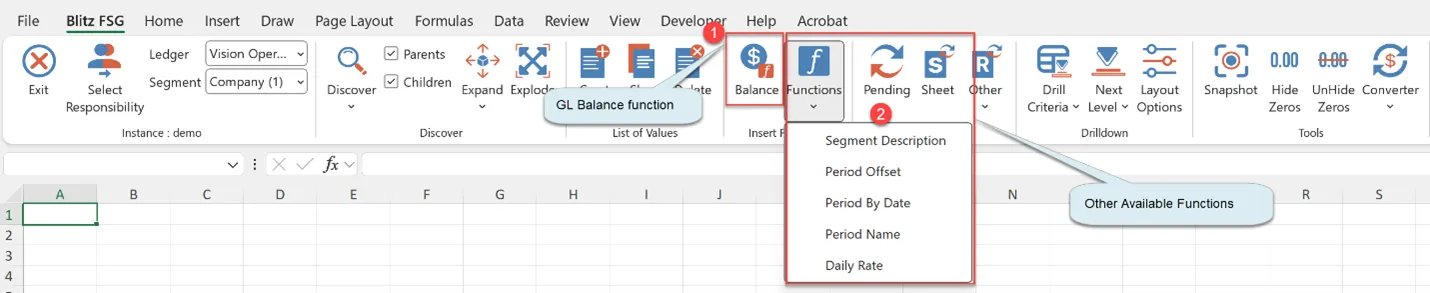
2.5 Insert Functions
Blitz FSG provides a suite of custom Excel functions that enable dynamic data extraction from Oracle. To use these functions click on dedicated function button like ‘Balance’ or select one from the ‘Functions’ dropdown menu.
Using the Function Form
- Parameter Selection
- Choose values from list of values, which are dynamically populated with:
- Valid options for each parameter pulled directly from Oracle.
- Cell Referencing
- Click the Link button to bind a parameter to an Excel cell.
- For ranges: Press F4 to toggle between absolute/relative referencing (standard Excel behavior).
- The field highlighted yellow are required parameters.
- Range: Defined with a hyphen (-).
Example: 1110-1150 - Exclusion: Prefix with a tilde (~). Applies to single values or
Examples:- Single: ~1113034
- Range: ~1110-1120
- Multiple Values on the cells: Separated by semicolons (;).
- If you want to choose all the values you could choose to keep the parameter as blank, this is same as passing ‘%’
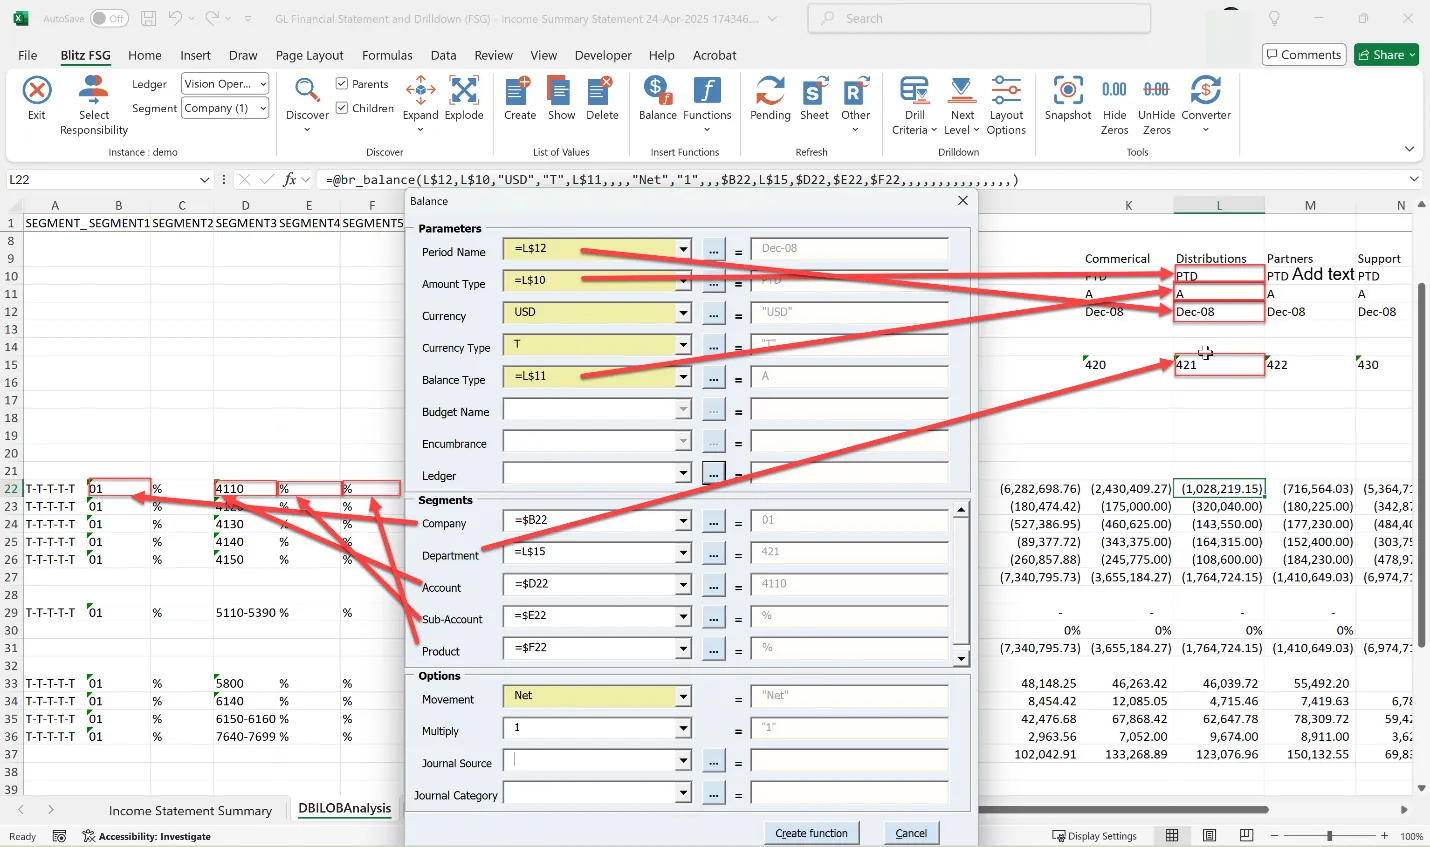
Balance
As the cornerstone of Blitz FSG, the Balance function retrieves General Ledger balances—either individually or aggregated—based on your specified parameters. To begin, click the Balance button on the Blitz FSG toolbar to open the function form.
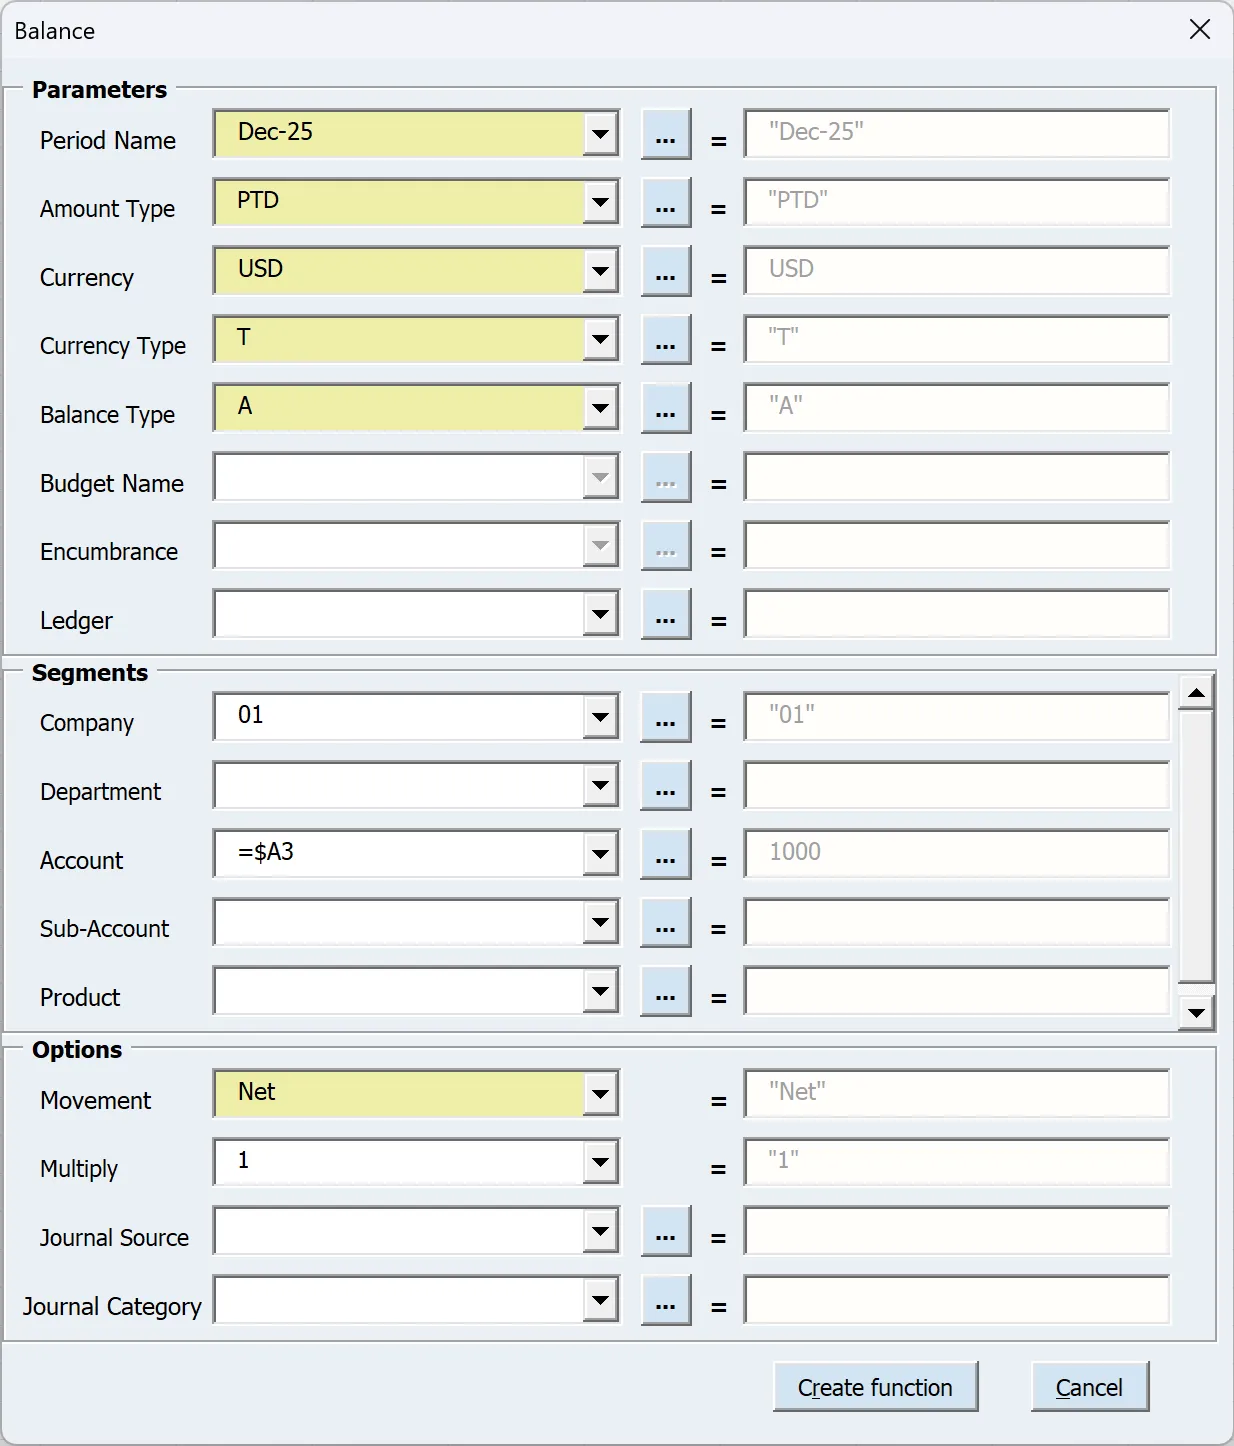
Formula : br_balance(“Dec-25″,”PTD”,”USD”,”T”,”A”,,,,”Net”,”1″,,,”01″,,$A3,,,,,,,,,,,,,,,,,)
Parameters:
| Period Name | The period name must exactly match the format configured in Oracle. For instance, if your Oracle system uses “Jan-07” as the period format, entering variations like “JAN-2007”, “January-07”, or “jan-07” will result in no data being returned and will trigger an “invalid (Period)” message. When used with the custom balance type CTD (Custom to Date), you can specify a custom period range such as “Feb-07-Aug-07” to aggregate movement data across multiple periods. This parameter supports multiple period ranges and lists, including wildcard entries like “Jan-0%” or “%-07” for flexible period matching. For the special balance types “JED”, “JEDU”, or “JEDP” (Journal Effective Date), the period parameter functions as a date parameter, accepting entries like “01/01/2007-05/01/2007;10/01/2007”. The date format is critical—the hyphen (“-“) serves as a range delimiter in Blitz FSG and cannot be used as a date separator. For example, “01-01-2007” would be invalid if your Windows regional settings use hyphens as date delimiters. To avoid issues, we recommend using slashes (“/”) as date separators and formatting dates as text in Excel to prevent automatic conversion based on regional settings. |
| Amount Type | Balance Type Parameters (All values must be in uppercase):
|
| Currency | Oracle currency code (uppercase) – Example: USD |
| Currency Type | Use the following codes to specify which Currency type to retrieve:
|
| Balance Type | A – Actual, B – Budget, E – Encumbrance. |
| Budget Name | If Balance Type is selected as ‘B’, this field will be enabled for input. Enter one or more budget names, separating multiple entries with the designated list delimiter character. |
| Encumbrance | If Balance Type is selected as ‘E’, this field will be enabled for input. Enter one or more encumbrance types, separating multiple entries with the designated list delimiter character. |
| Ledger | If this parameter is left blank, the system will calculate balances using the ledger selected in the dropdown menu. The ledger dropdown values are dynamically populated based on your assigned responsibilities. Note that changing the ledger selection will automatically trigger a re-evaluation of the Segments parameter. |
| Segments (1-20) | Enter segment value in these fields. Format the value exactly as configured in Oracle, including all leading zeros (e.g., enter “0010” for a four-character segment where Oracle stores “10” with leading zeros). Accepted Formats:
Note: Leave blank or enter “%” to include all possible values Lists always function as OR conditions (e.g., “1110;1210” returns accounts matching either value) Changing ledger selections may affect available segment values |
| Movement | Debit – Dr, Credit – Cr, Both – Net |
| Multiply | 1 or -1– Use this parameter to switch the sign of the balance |
| Journal Source | Limits the result to journal sources. |
| Journal Category | Limit the results to journal categories. |
Segment Description
Returns the description and corresponding value for the specified segment within the applicable ledger context.
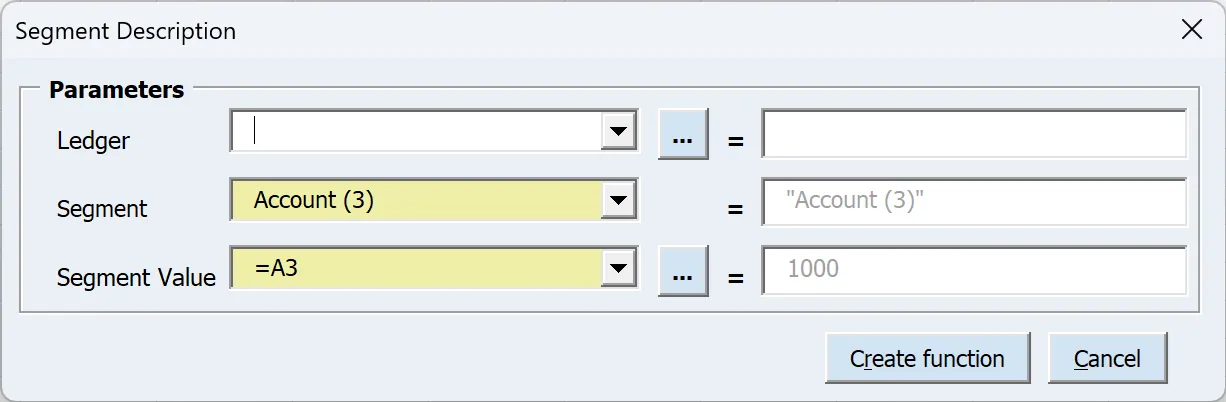
Formula : br_segment_description(“Account (3)”,A3,)
Parameters:
| Ledger | If this parameter is left blank, the system will evaluate using the ledger selected in the dropdown menu. The ledger dropdown values are dynamically populated based on your assigned responsibilities. Note that changing the ledger selection will automatically trigger a re-evaluation of the Segment parameter list of values. |
| Segment | The segment name. |
| Segment Value | The segment value. |
Period Offset
Returns the period name located a specified number of periods before (negative values) or after (positive values) a reference point.
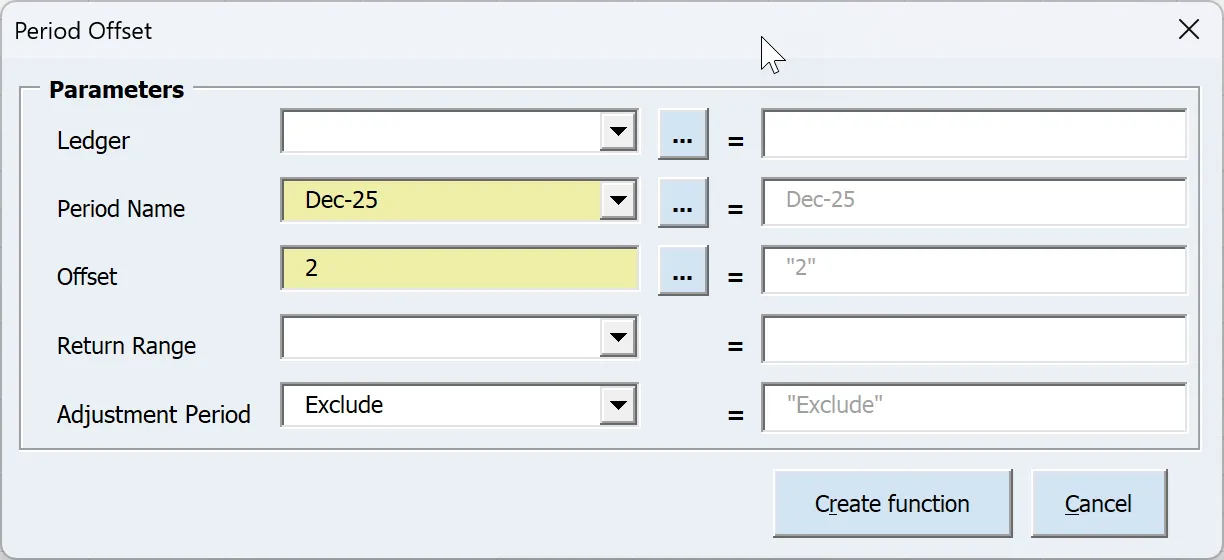
Formula : br_period_offset(“Dec-25″,”2″,,”Exclude”,)
Parameters:
| Ledger | If this parameter is left blank, the system will evaluate using the ledger selected in the dropdown menu. |
| Period Name | The period name must exactly match the format configured in Oracle. For instance, if your Oracle system uses “Jan-07” as the period format, entering variations like “JAN-2007”, “January-07”, or “jan-07” will result in no data being returned and will trigger an “invalid (Period)” message. |
| Offset | Enter a numerical value to retrieve period names relative to your specified criteria:
|
| Return Range | When enabled (Yes), formats results as a period range spanning from offset to base period. Example: Mar-08 with offset -2 returns ‘Jan-08-Mar-08’. |
| Adjustment Period | Use this parameter to control how adjustment periods are handled in your results, by default it includes. Exclude: Adjustment periods are filtered out |
Period by Date
Returns the accounting period name corresponding to the specified date.
Options:
- Ledger-specific: Returns period names according to the selected ledger’s calendar
- Period offset: Retrieve future or past periods by specifying a positive/negative offset value
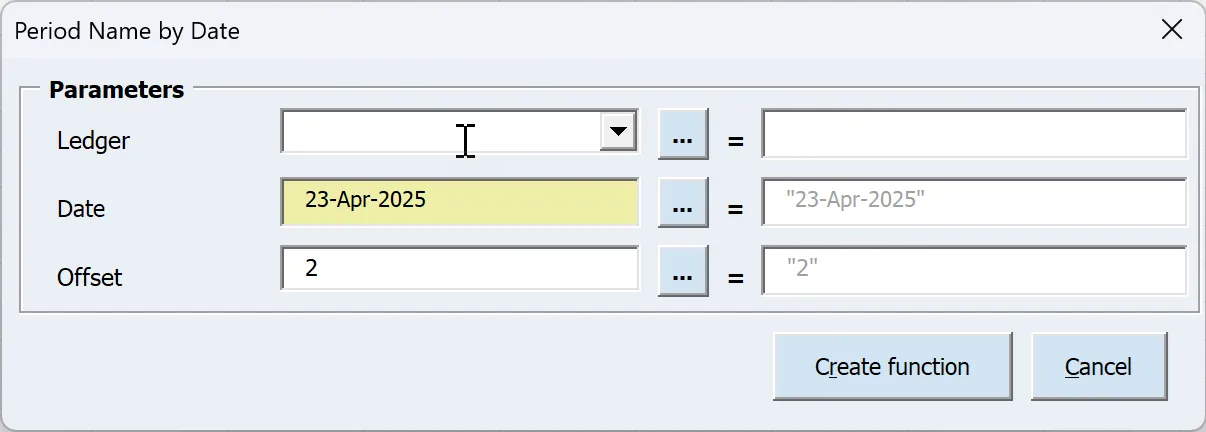
Formula : br_period_from_date(“23-Apr-2025″,,”2”)
Parameters:
| Ledger | If this parameter is left blank, the system will evaluate using the ledger selected in the dropdown menu. |
| Date | The date that you want the period name for. |
| Offset | Enter a numerical value to retrieve period names relative to your specified criteria:
|
Period Name
Returns the accounting period name for a specified year and period number.
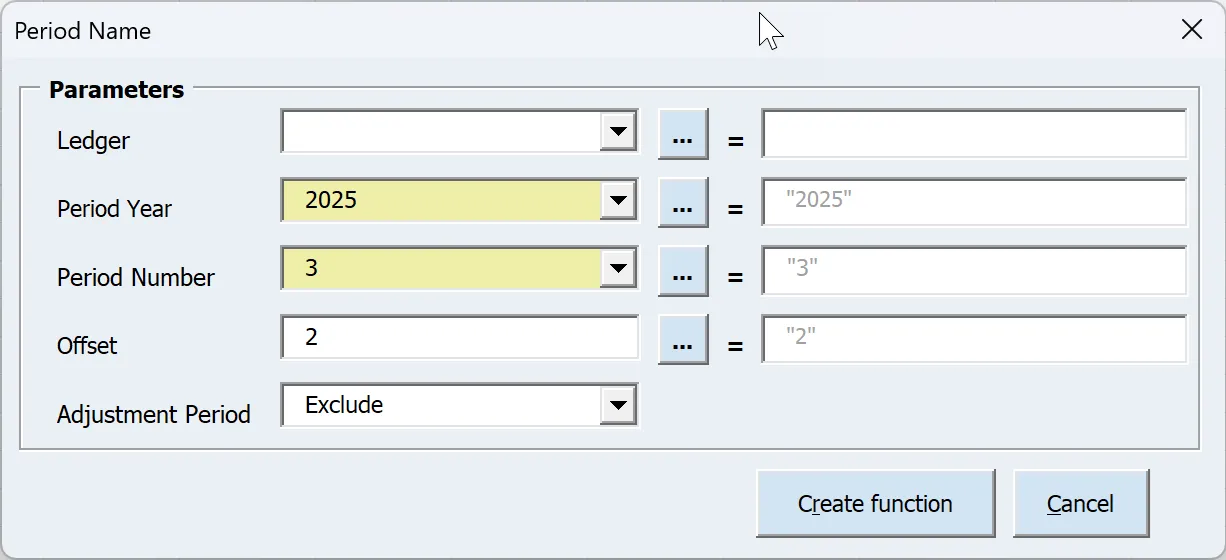
Formula : br_period_name(“2025″,”3″,,”2″,”Exclude”)
Parameters:
| Ledger | If this parameter is left blank, the system will evaluate using the ledger selected in the dropdown menu. |
| Period Year | The year that you want the period name for. |
| Period Number | The period number that you want the period name for. |
| Offset | Enter a numerical value to retrieve period names relative to your specified criteria:
|
| Adjustment Period | Use this parameter to control how adjustment periods are handled in your results, by default it includes. Exclude: Adjustment periods are filtered out |
Daily Rate
Returns the daily currency conversion rate for the selected currencies, date and conversion type.
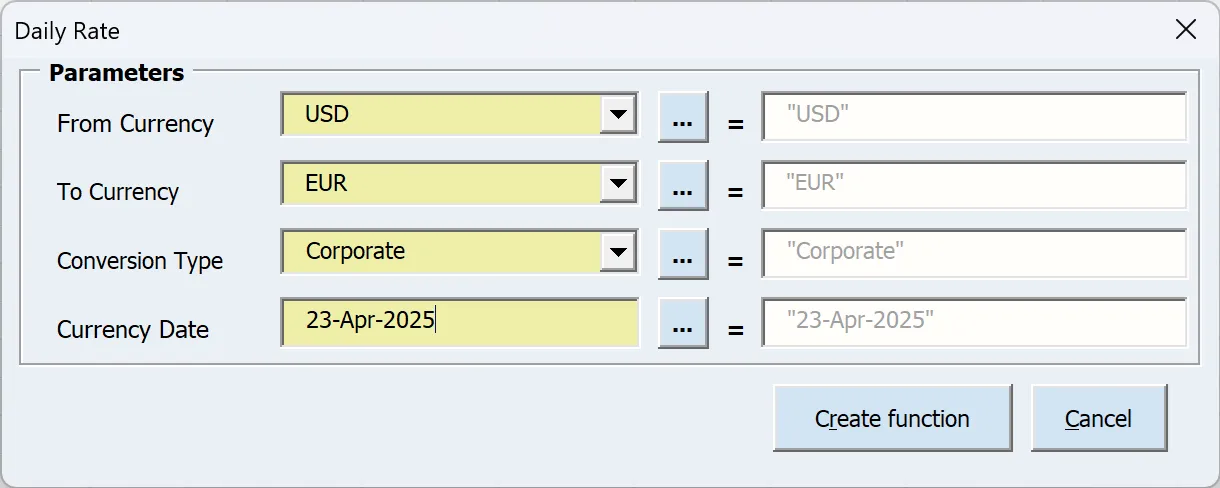
Formula : br_daily_rate(“USD”,”EUR”,”Corporate”,”23-Apr-2025″)
Parameters:
| From Currency | The currency to convert from. |
| To Currency | The currency to convert to. |
| Conversion Type | The currency conversion type. |
| Currency Date | The date to convert the currencies. |
Refreshing Data with Pending Calculations
To refresh only cells requiring recalculation (marked as “(pending)”):
- Click the Pending refresh button.
Refreshing a Sheet
To calculate an entire sheet:
- Select the desired sheet
- Click the Sheet refresh button
Refreshing Specific Ranges
To calculate selected cells:
- Highlight your target range
- For multiple ranges: Hold Ctrl while selecting (standard Excel behavior)
- Click the Range refresh button
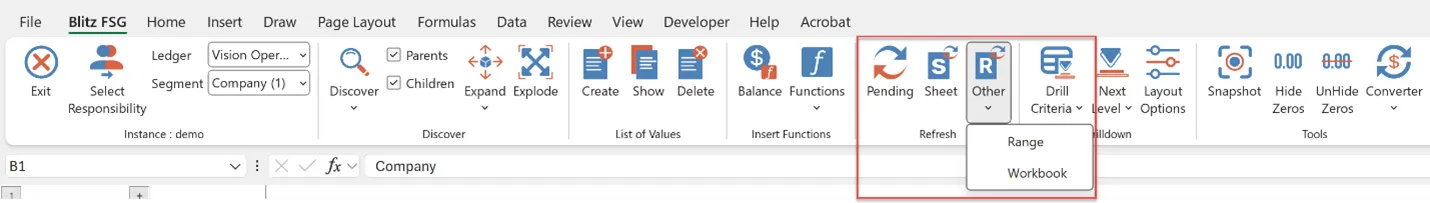
Refreshing the Entire Workbook
To refresh all calculations in the workbook:
- Click the Workbook refresh button
2.7 Drilldown
In Blitz FSG, drilldown data is extracted through Blitz Reports such as ‘GL Journal (Drilldown)’ and ‘GL Account Analysis (Drilldown).’ Each of these reports has templates that define which columns are displayed, their sequence, and sorting order. Users can create custom templates to add, remove, sort, or reorder columns as needed. Although the report is designed to be comprehensive and cover all possible data columns, users with developer access can create a custom copy of the drilldown reports to add any missing columns if required.
Drill Criteria
There are two types of drill criteria sheets available:
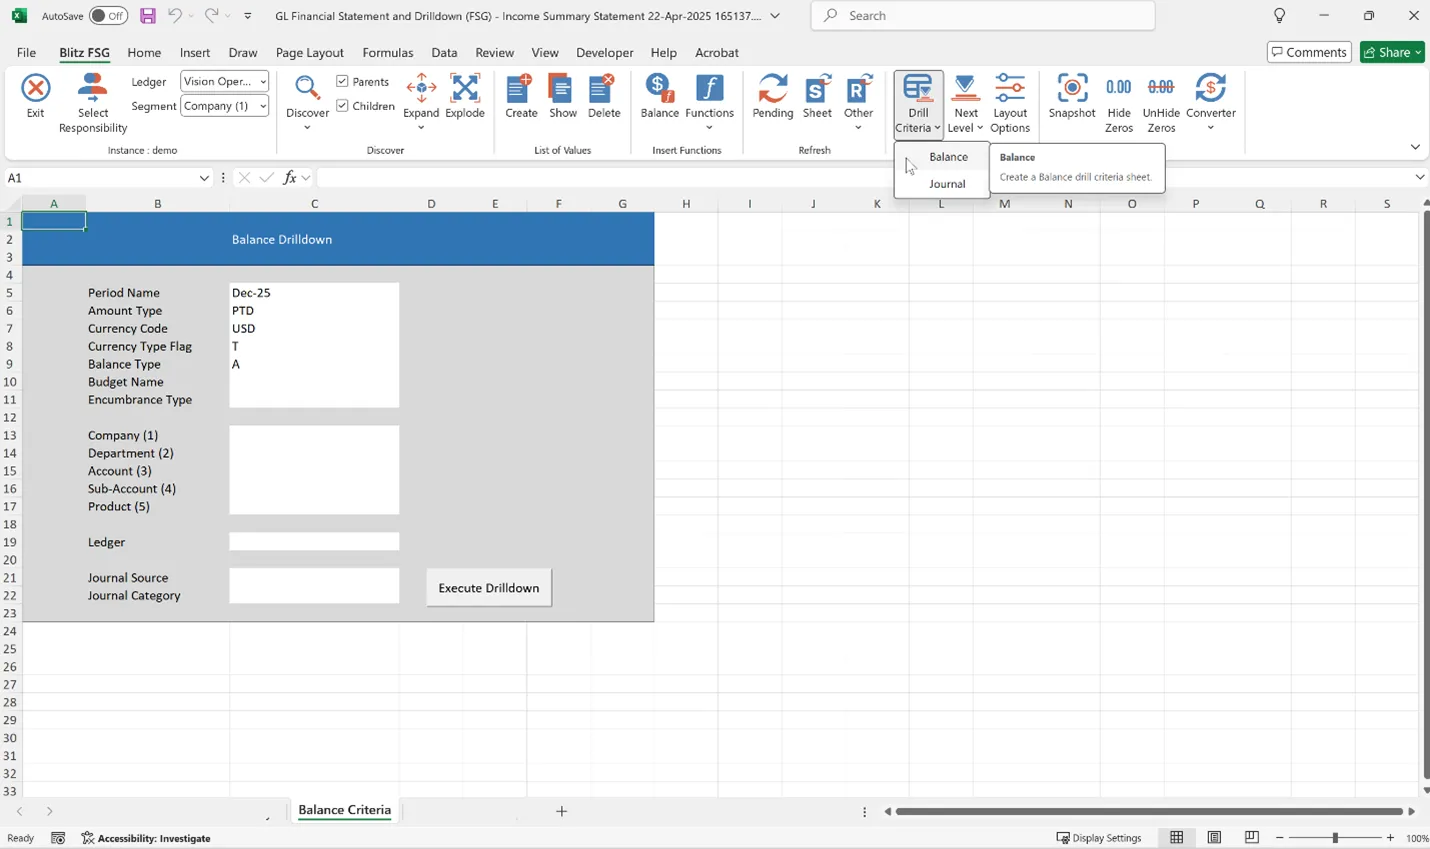
Balance Drill Criteria
The Balance Criteria Sheet enables rapid extraction of detailed general ledger balances that meet specific criteria. This is particularly useful when working with large volumes of GL data, as it returns values faster than multiple individual Get Balance formulas.
How to Use:
- Enter Extraction Parameters
- Criteria mirror the Get Balance function parameters and operate identically.
- Manually type values or select from a list by double-clicking the target cell.
- Define Your Criteria
- Period: Enter the fiscal period.
- Amount Type:
- YTD: Extracts all journal lines for the year (drill-down).
- QTD: Extracts journals for the quarter (drill-down).
- Currency Code: Enter the currency code.
- Balance Type:
- E (Entered) or T (Translated); use Total for Oracle R12.
- A (Actual), B (Budget), or E (Encumbrance).
- For B/E, specify the Budget Name or Encumbrance Type.
- Segment Values: Populate as needed.
- Ledger: Adjust if required.
- Journal Source/Category: Optional filter to narrow results.
- For B/E, specify the Budget Name or Encumbrance Type.
- Execute
- Click Execute Drilldown to run the report.
- From there, you can further drill down into:
- Individual journals
- Related subledger entries
- Journal attachments
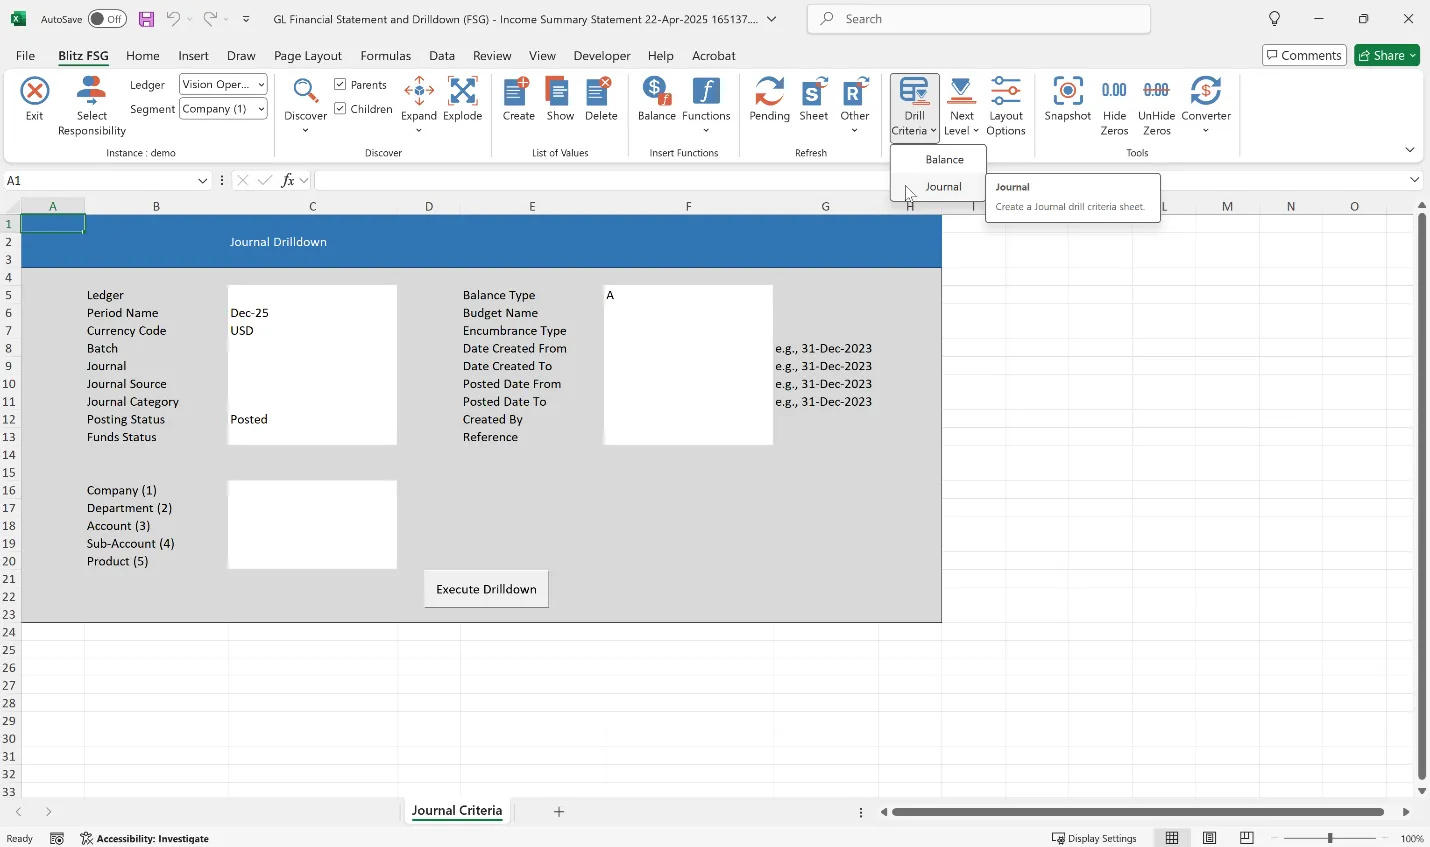
Journal Extract Drill Criteria
The Journal Extract Drill Criteria Sheet enables users to extract journal entries based on specified criteria.
How to Use:
- Enter Extraction Parameters
- Manually type values or select from a list by double-clicking the field (where applicable).
- Single values supported for parameters like Batch and Journal Name.
- Ranges/lists are supported for journal parameters like Source, Category, Budget Name and Encumbrance.
- Date Parameters like Date Created / Posted Date: Dates are treated as inclusive (e.g., 01-JAN-2024 includes all entries up to 23:59:59 on that day). Time components are ignored.
- Created By: Enter a valid Oracle username.
- Execute
- Click Execute Drilldown button to run the report.
- From there, you can further drilldown into:
- Associated subledger entries
- Journal attachments
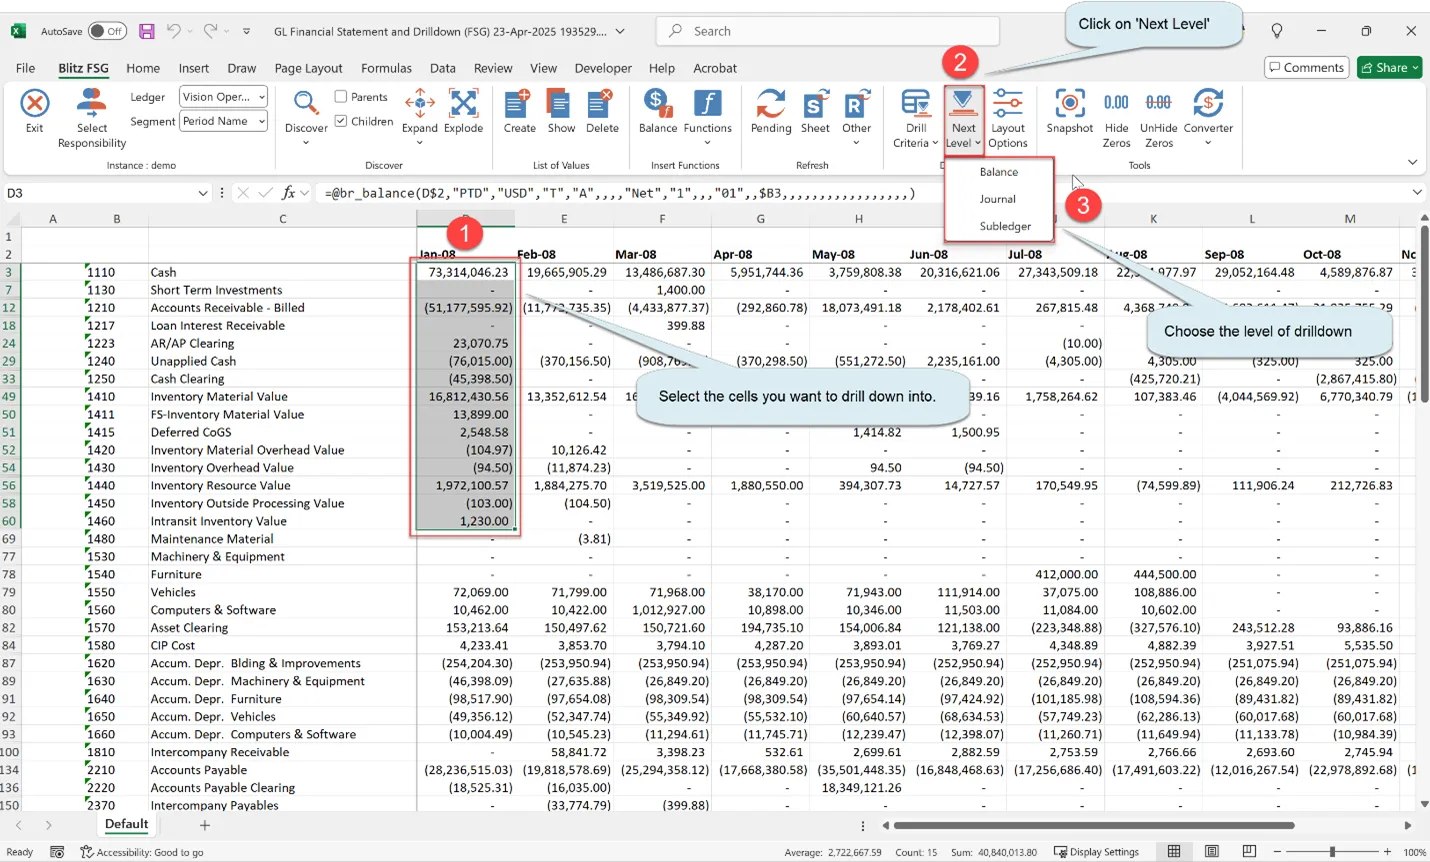
Next Level Drilldown
To drill down to Balance, Journal, or Subledger data from the balance sheet:
- Single selection:
- Select one balance
- Choose Next Level Drilldown > [desired option]
- Multiple selections:
- Select multiple balances
- Click Next Level Drilldown > [desired option]
To drill down further for multiple rows on the Balance/Journal Drilldown sheet:
- Select the desired cells.
- Right-click and choose “Journal Drilldown” from the context menu.
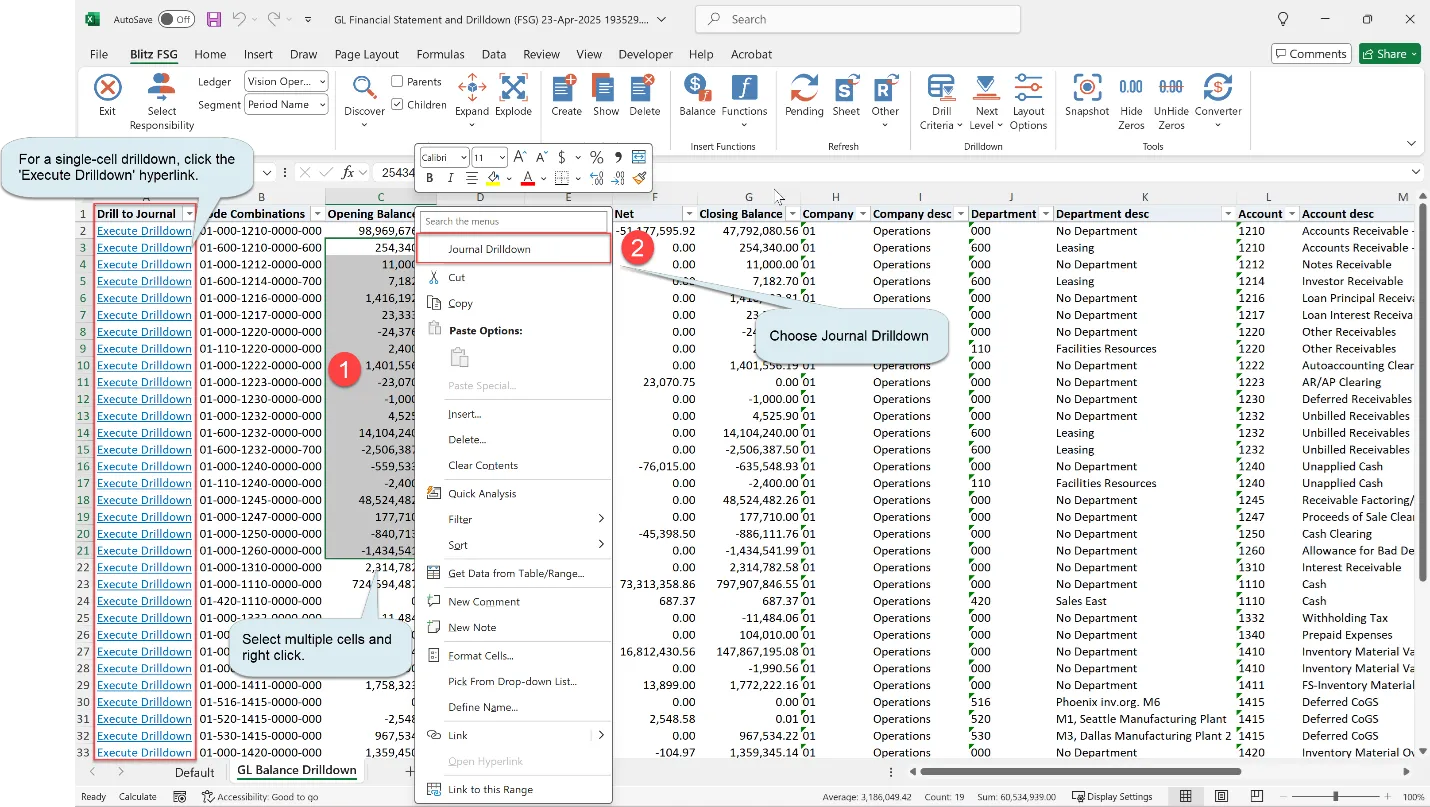
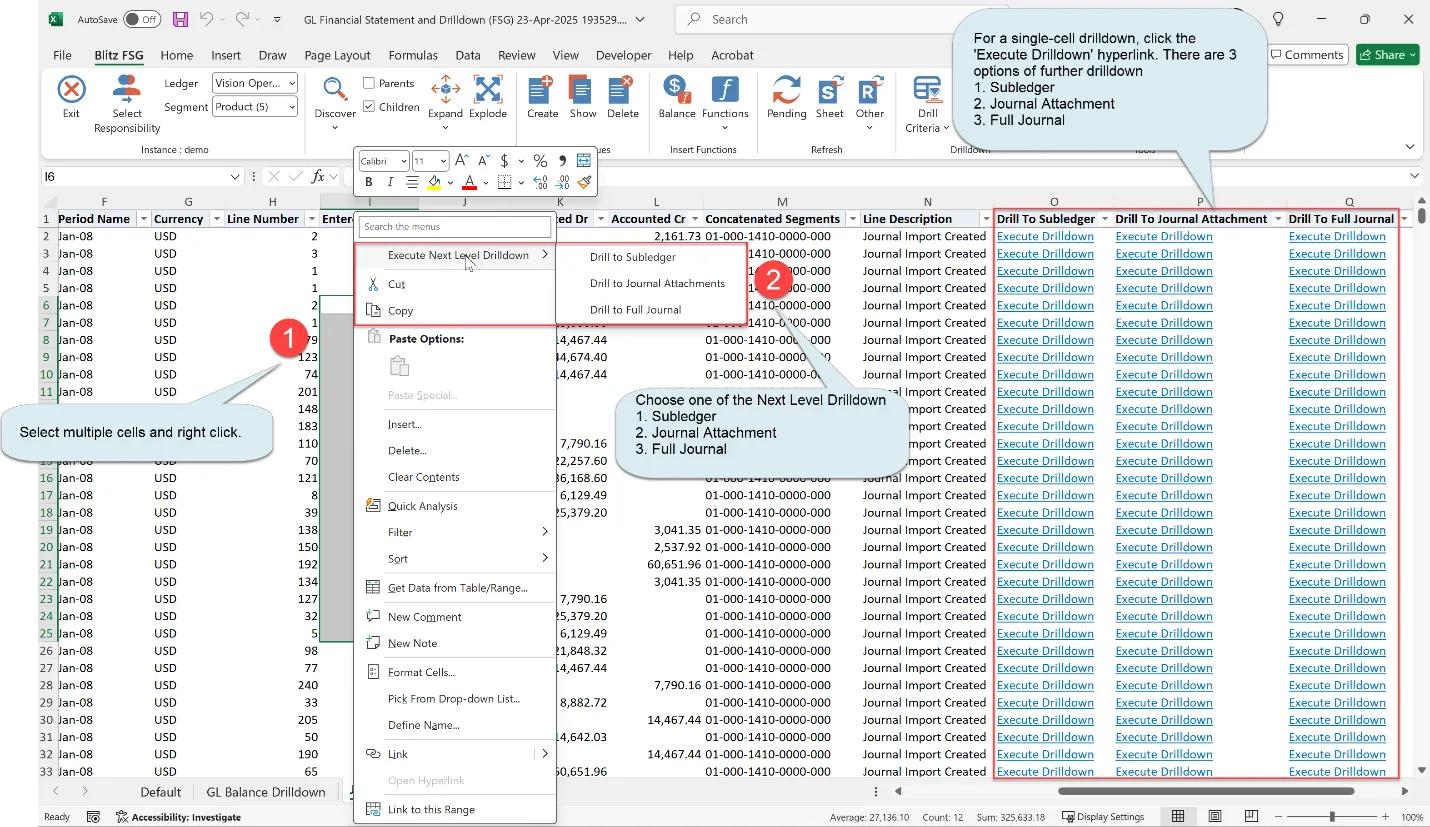
Select a Next-Level Drilldown Option from the Journal Drilldown Sheet:
- Subledger
- Journal Attachment
- Full Journal
- For a single-cell drilldown: Click the ‘Execute Drilldown’ hyperlink.
- For multiple-cell drilldown: Select the desired cells, right-click, and choose the next-level drilldown option.
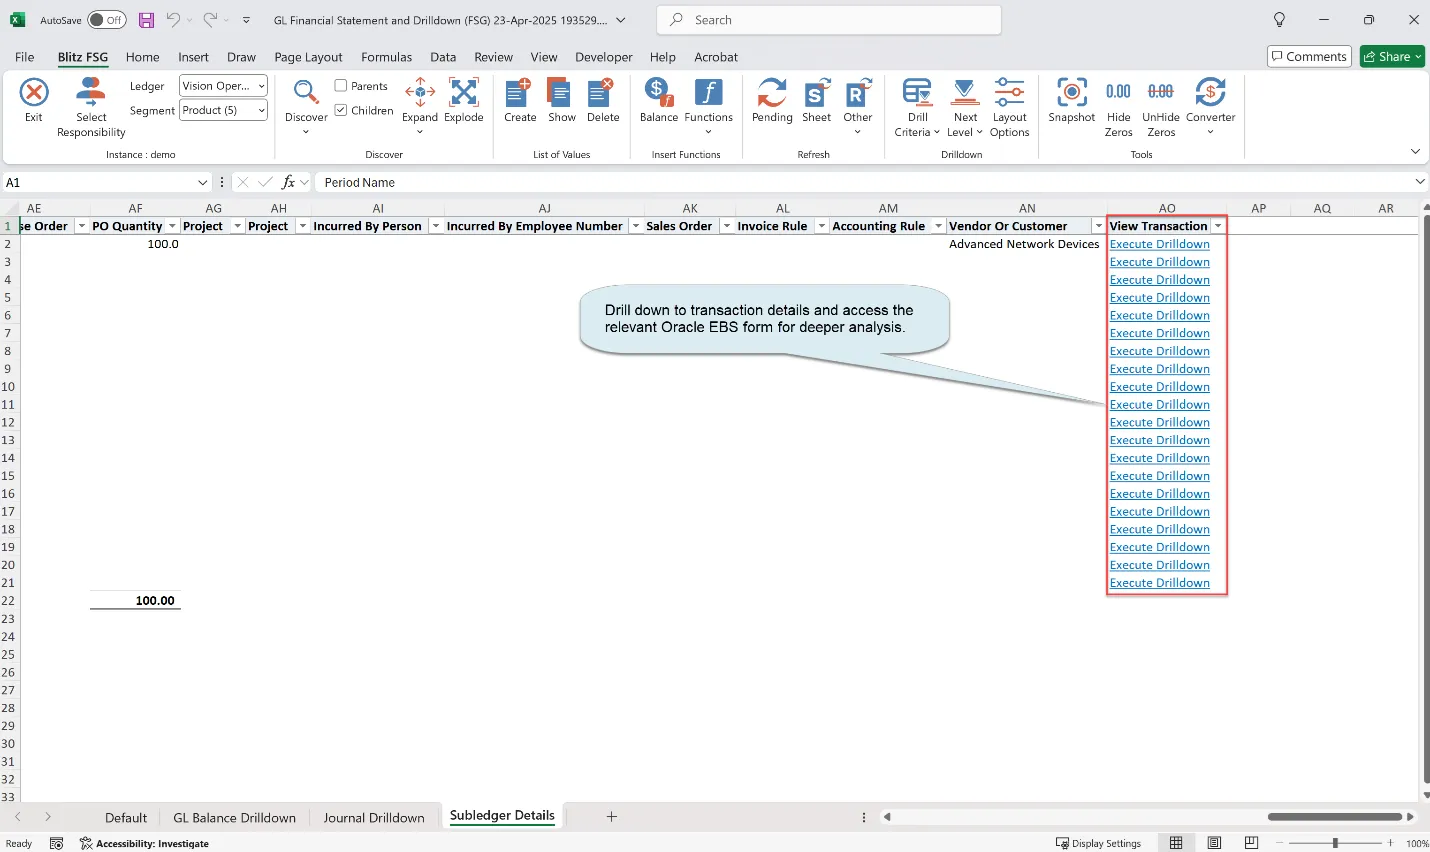
Drill down to transaction details and access the relevant Oracle EBS form for deeper analysis.
Layout Options
After defining the templates in Blitz Reports, follow the steps below to select your preferred drilldown data.
1. Click on ‘Layout Options’ to select the report and template for displaying the customized drilldown data.
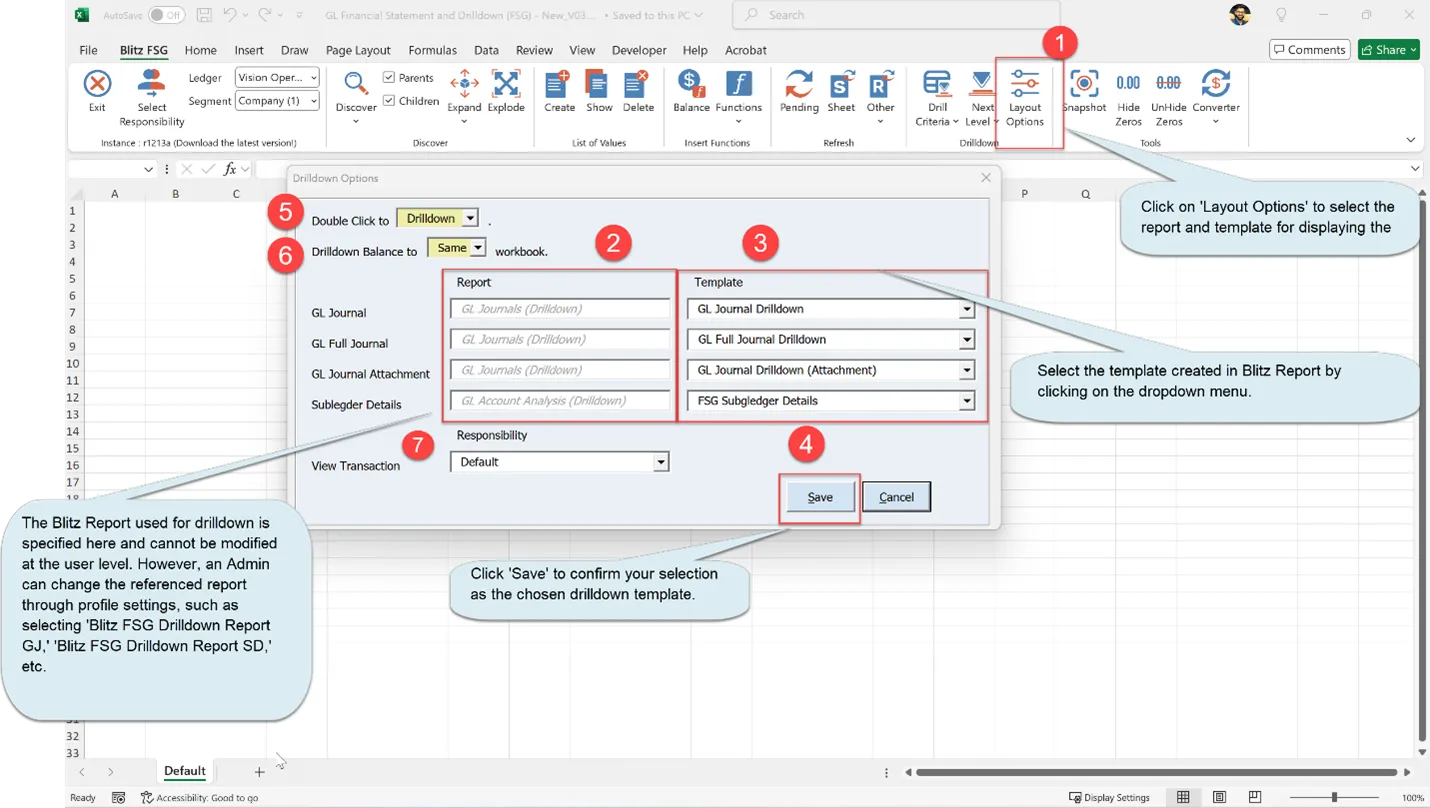
2. The Blitz Report used for drilldown is specified here and cannot be modified by user. However, an Admin can change the referenced report through updating the below profiles settings for the corresponding drilldown
| Drilldown Level | User Profile Name |
| GL Journal | Blitz FSG Drilldown Report GJ |
| GL Full Journal | Blitz FSG Drilldown Report GFJ |
| GL Journal Attachment | Blitz FSG Drilldown Report GJA |
| Subledger Details | Blitz FSG Drilldown Report SD |
3. Select the template created in Blitz Report assigned to the drilldowns by clicking on the dropdown menu. Users can create custom templates to add, remove, sort, or reorder columns as needed.
4. Click ‘Save’ to confirm your selection as the chosen drilldown template.
5. The double-click action for a balance cell can be set to either drill down or launch the Balance Function form.
6. The drilldown can be configured to open in either a new workbook or a new worksheet.
7. The ‘View Transaction’ drilldown can be configured to open the transaction form either in the default responsibility (used to run the GL Financial Statement and Drilldown report) or in any GL responsibility with Subledger drilldown access.
Creating a Custom Drilldown Template
The drilldown reports (‘GL Journal (Drilldown)’ and ‘GL Account Analysis (Drilldown)’) use templates to define which columns are displayed, their sequence, and sorting preferences. Users can create custom templates to tailor the drilldown view to their specific needs.
To create a new drilldown template:
1. Navigate to the FSG drilldown report – GL Journal (Drilldown), GL Account Analysis (Drilldown)’ or custom drilldown report.
2. Create a new or copy existing template
The template window allows you to configure the following elements:
Name – Enter a descriptive name for your template
Description – Optional description of the template’s purpose
Available Columns – List of columns available but not currently displayed
Displayed Columns – Columns included in the drilldown output
Use the arrow buttons to move columns between “Available” and “Displayed” lists, and to change display order. You can use Ctrl and Shift keys for multi-select.
Sort Order – Ascending or descending sort for each column
Sort Priority – Determines sort precedence when multiple columns are sorted
For detailed information on all template options including pivot tables and Excel uploads, refer to section 1.5 Templates
Under Blitz FSG Tools you can:
Snapshot
Use the Snapshot tool to convert your Blitz FSG report into static values.
This feature:
- Removes all Blitz FSG functions from the workbook, replacing them with the returned values.
- Preserves all other Excel formulas and formatting (only Blitz FSG functions are affected).
- Functions similarly to Excel’s Paste Values, but targets Blitz FSG content exclusively.
Ideal for:
- Finalizing reports for distribution.
- Reducing file size or improving performance.
- Archiving data without live Oracle connections.
Hide Zeros
Hide Zeros allows you to hide rows in a report that contain only zero values. This feature is especially useful for streamlining reports with many empty rows—such as those with no balances in a given period. With just one click, you can instantly remove all zero-value rows, improving readability and presentation.
Unhide Zeros
This will show the rows previously hidden by the Hide Zeros feature.
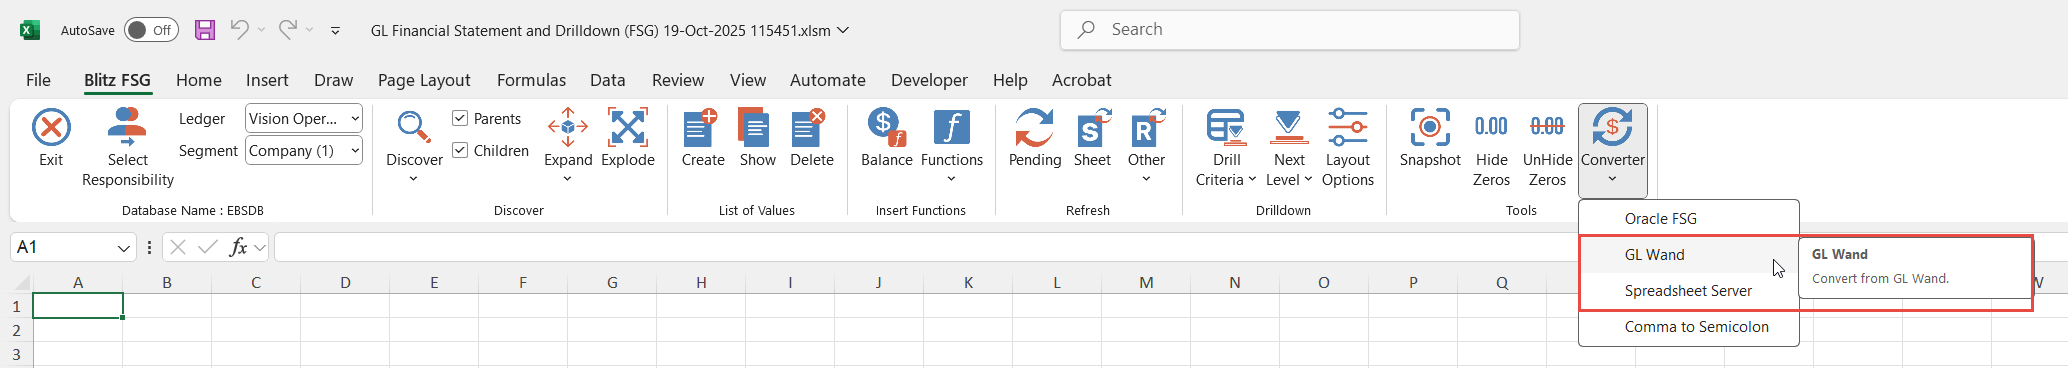
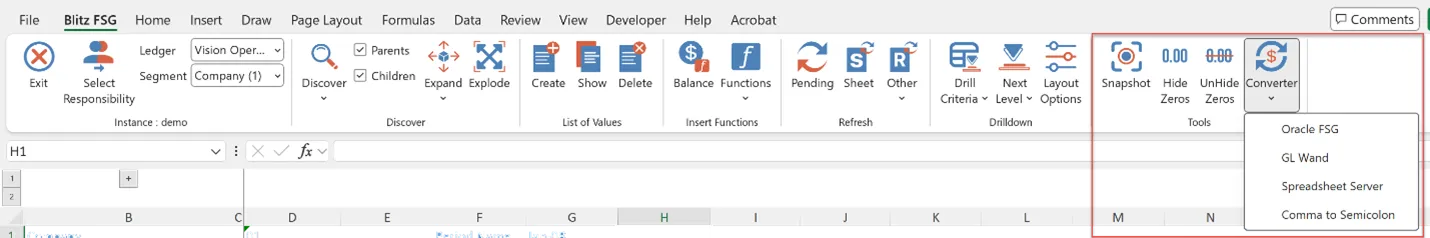
2.9 Converter
The Blitz FSG Converter allows you to import Financial Statement Generator (FSG) report definitions from Oracle FSG, as well as third-party tools like GL Wand and Spreadsheet Server.
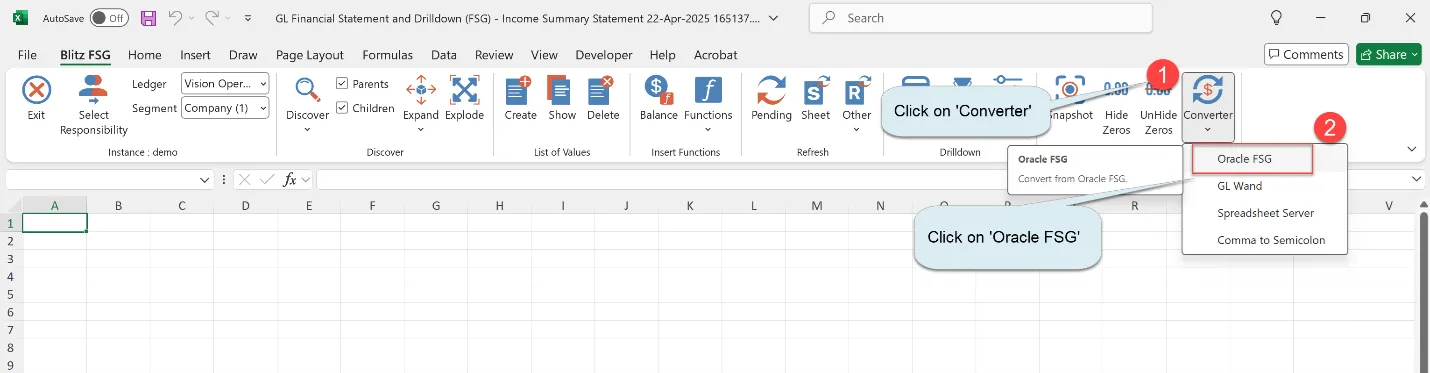
Oracle FSG
1. Click on ‘Oracle FSG’
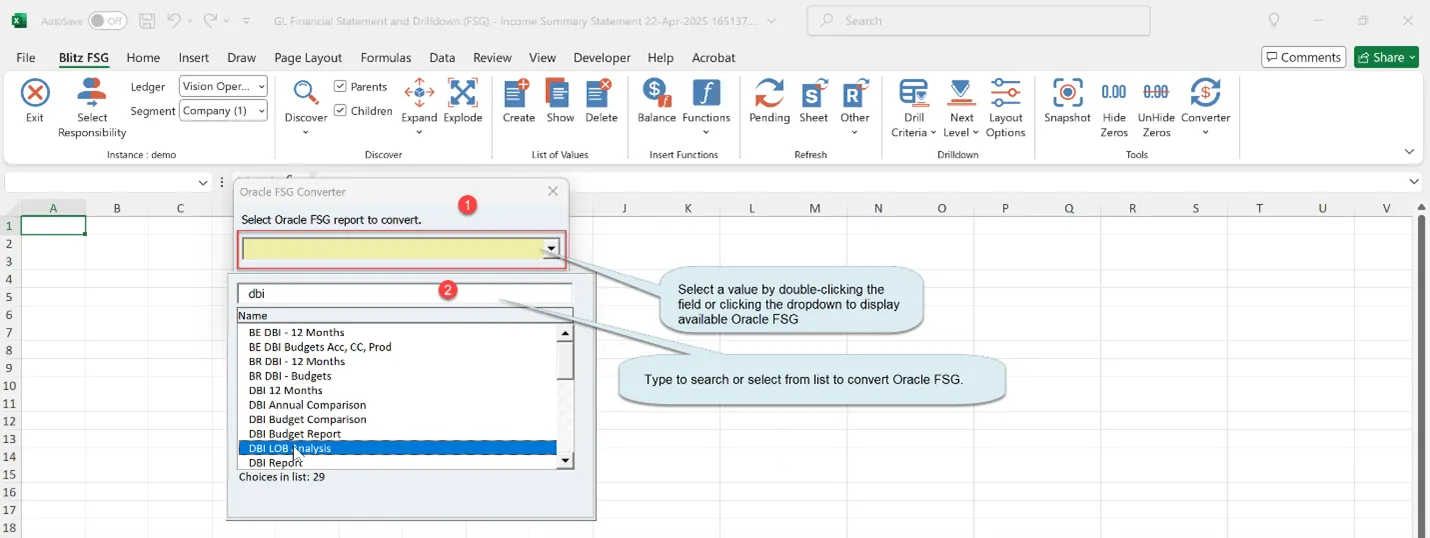
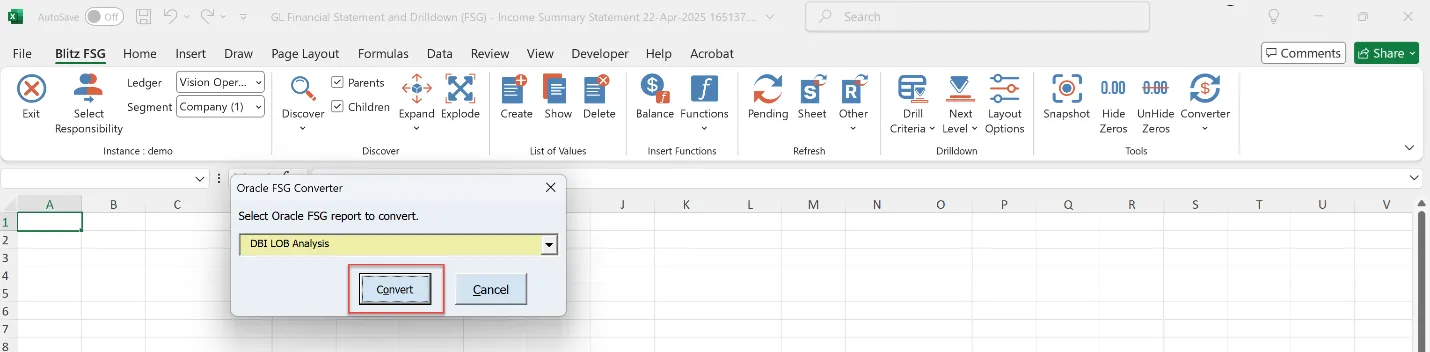
2. Select a value by double-clicking the field or clicking the dropdown to display available Oracle FSG.
3. Type to search or select from list to convert Oracle FSG.
4. Click ‘Convert’ to migrate to Blitz FSG
This will identify the Oracle FSG report’s row set, column set, and content set, then automatically replicate the draft template.
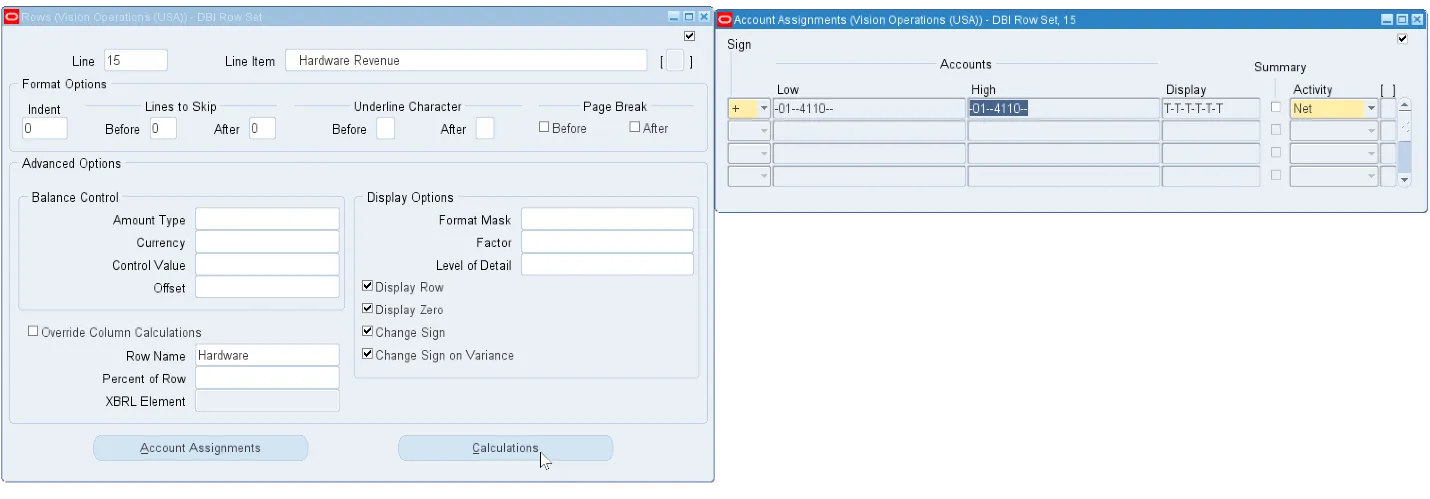
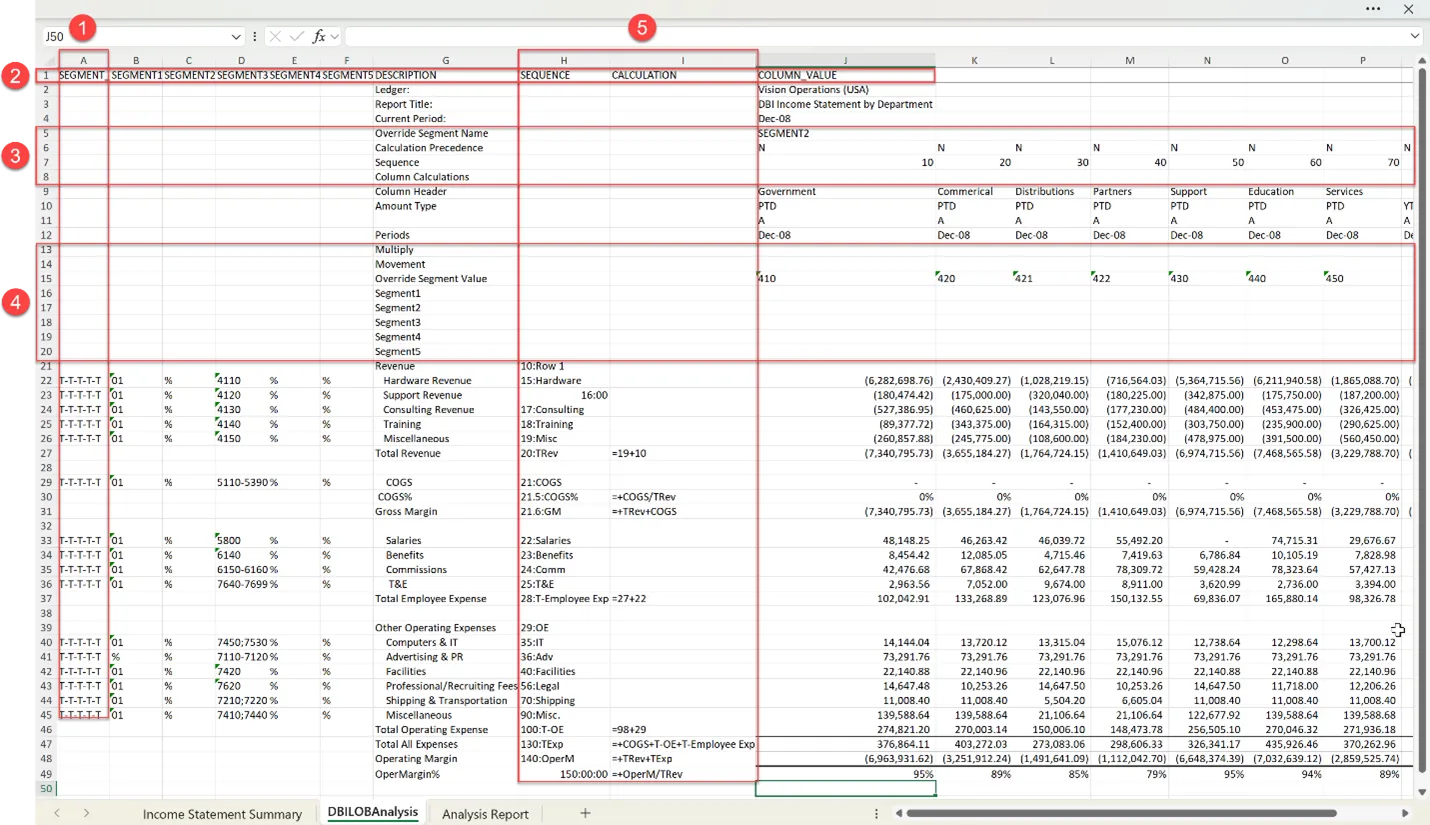
1. Row set information mapped between Oracle form and Blitz FSG Excel template
| Oracle Row Set | Converted Blitz FSG Excel Template |
| Row Set > Rows > Account Assignments | Column B to Column F based on the defined chart of account segments. |
| Row Set > Rows > Account Assignments > Display | Column A – Segment Type |
| Row Set > Rows > Line Item | Column G – Description |
| Row Set > Rows > Line : Row Name | Column H – Sequence |
| Row Set > Rows > Calculations | Column I – Calculations |
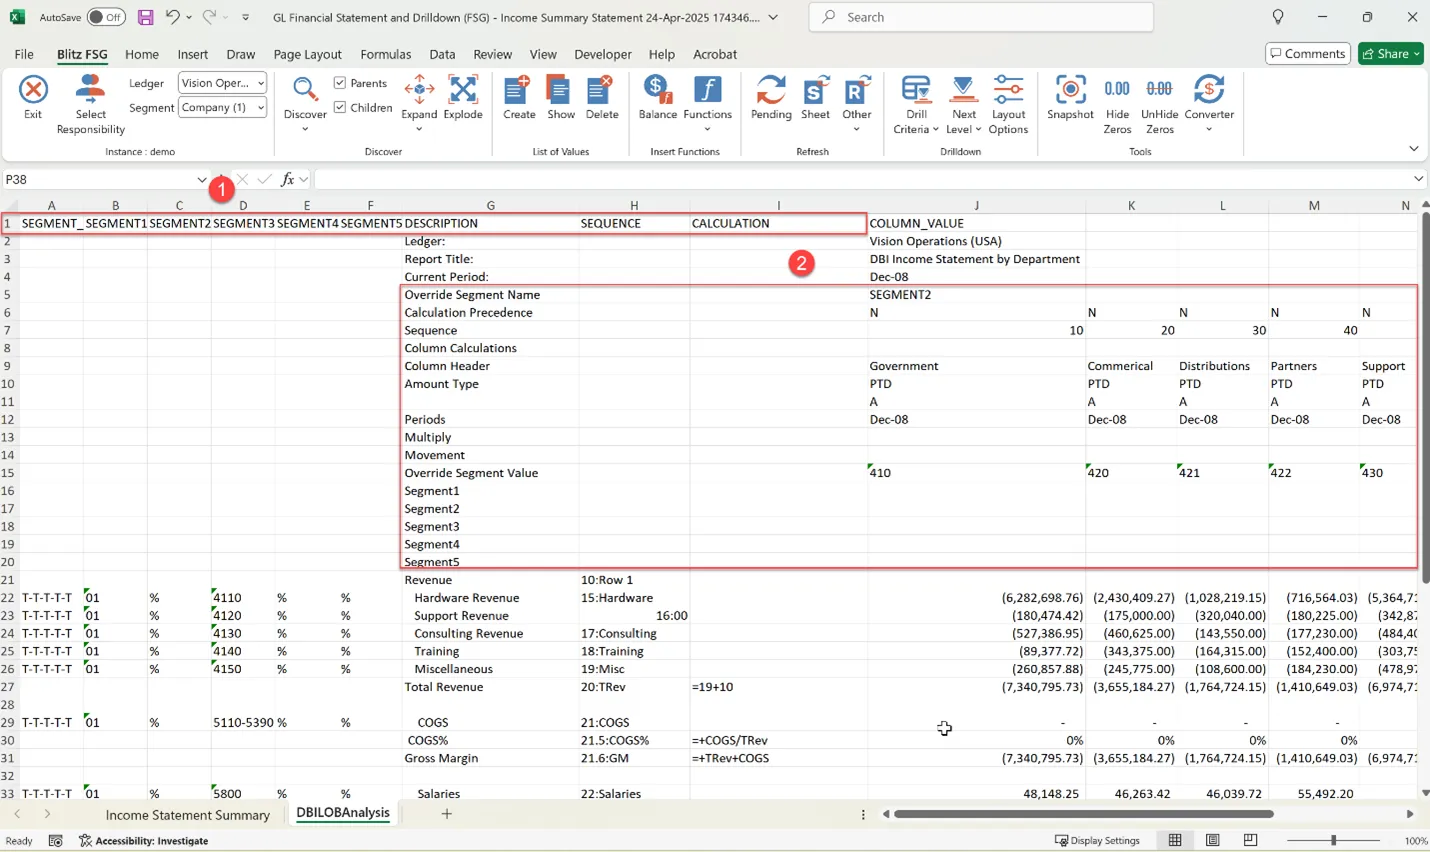
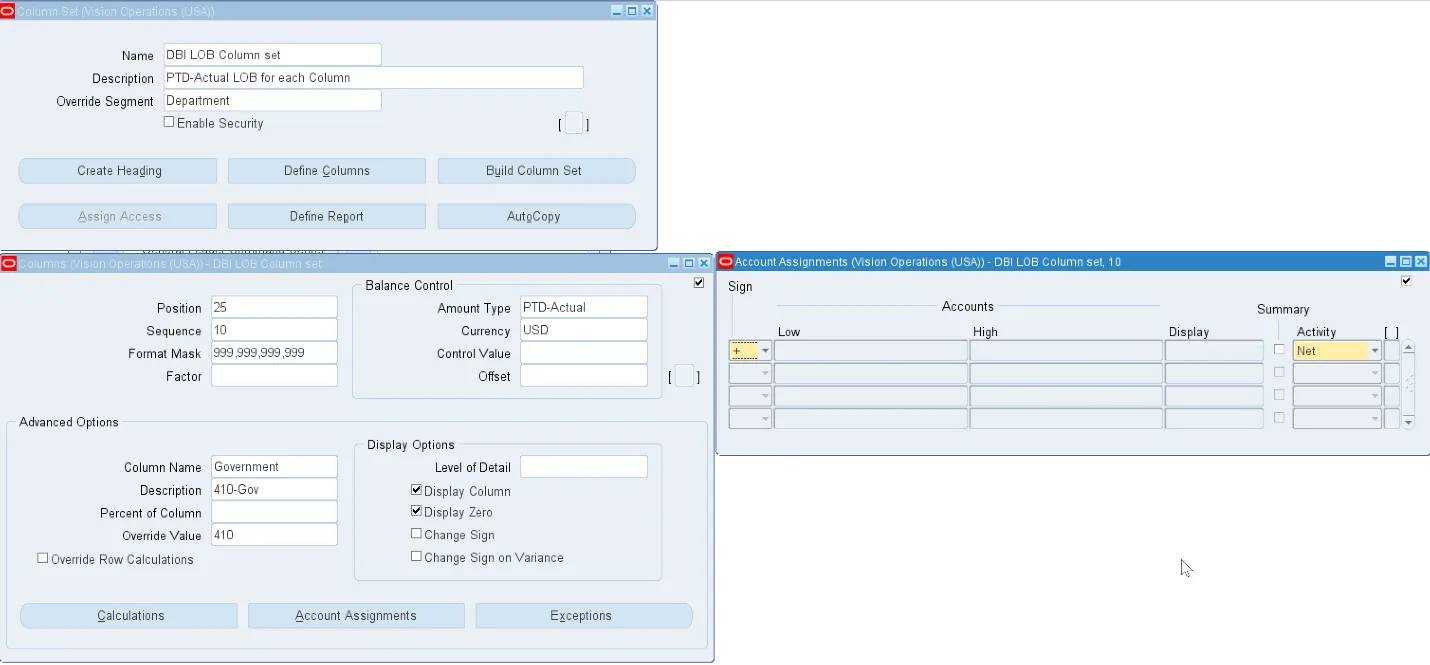
2. Column set information mapped between Oracle form and Blitz FSG Excel template
| Oracle Column Set | Converted Blitz FSG Excel Template |
| Column Set > Override Segment | Row 5 : Override Segment Name |
| Column Set > Column > Override Row Calculations | Row 6 : Calculation Precedence |
| Column Set > Column > Sequence | Row 7 : Sequence |
| Column Set > Column > Calculation | Row 8 : Column Calculations |
| Column Set > Column > Column Name | Row 9 : Column Header |
| Column Set > Column > Amount Type | Row 10 : Amount Type – Calculated based on the Amount type |
| Column Set > Column > Amount Type | Row 11 – Calculated based on the Amount type |
| Column Set > Column > Offset | Row 12 : Periods – Calculated based on the defined offset.
|
| Column Set > Column > Account Assignments > Sign | Row 13 : Multiply |
| Column Set > Column > Account Assignments > Activity | Row 14 : Movement |
| Column Set > Column > Override Value | Row 15 : Override Segment Value |
| Column Set > Column > Account Assignments | Row 16 to Row 20 based on the defined chart of account segments. |
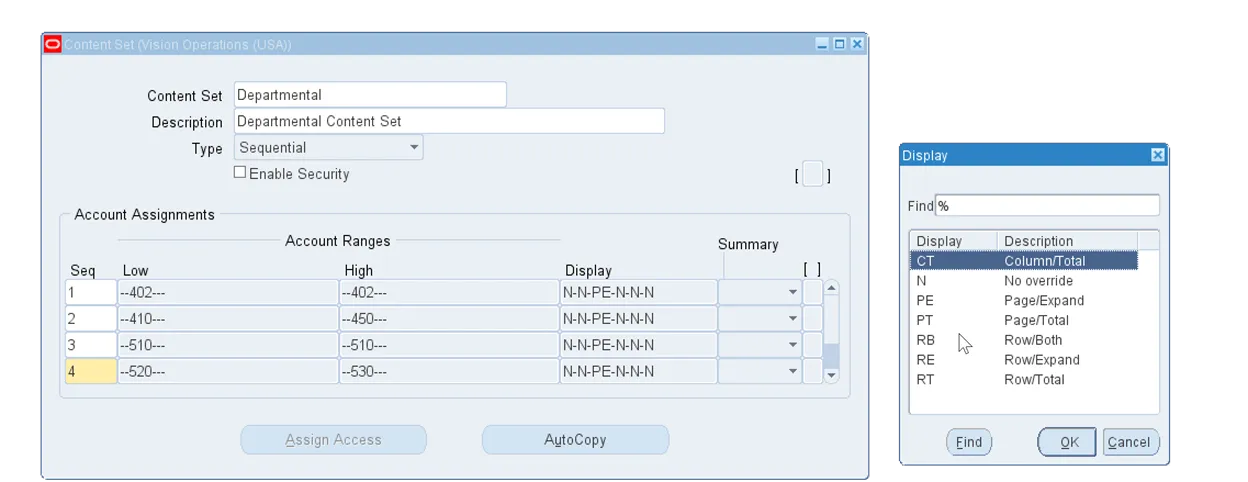
3. Content set information mapped between Oracle form and Blitz FSG Excel template
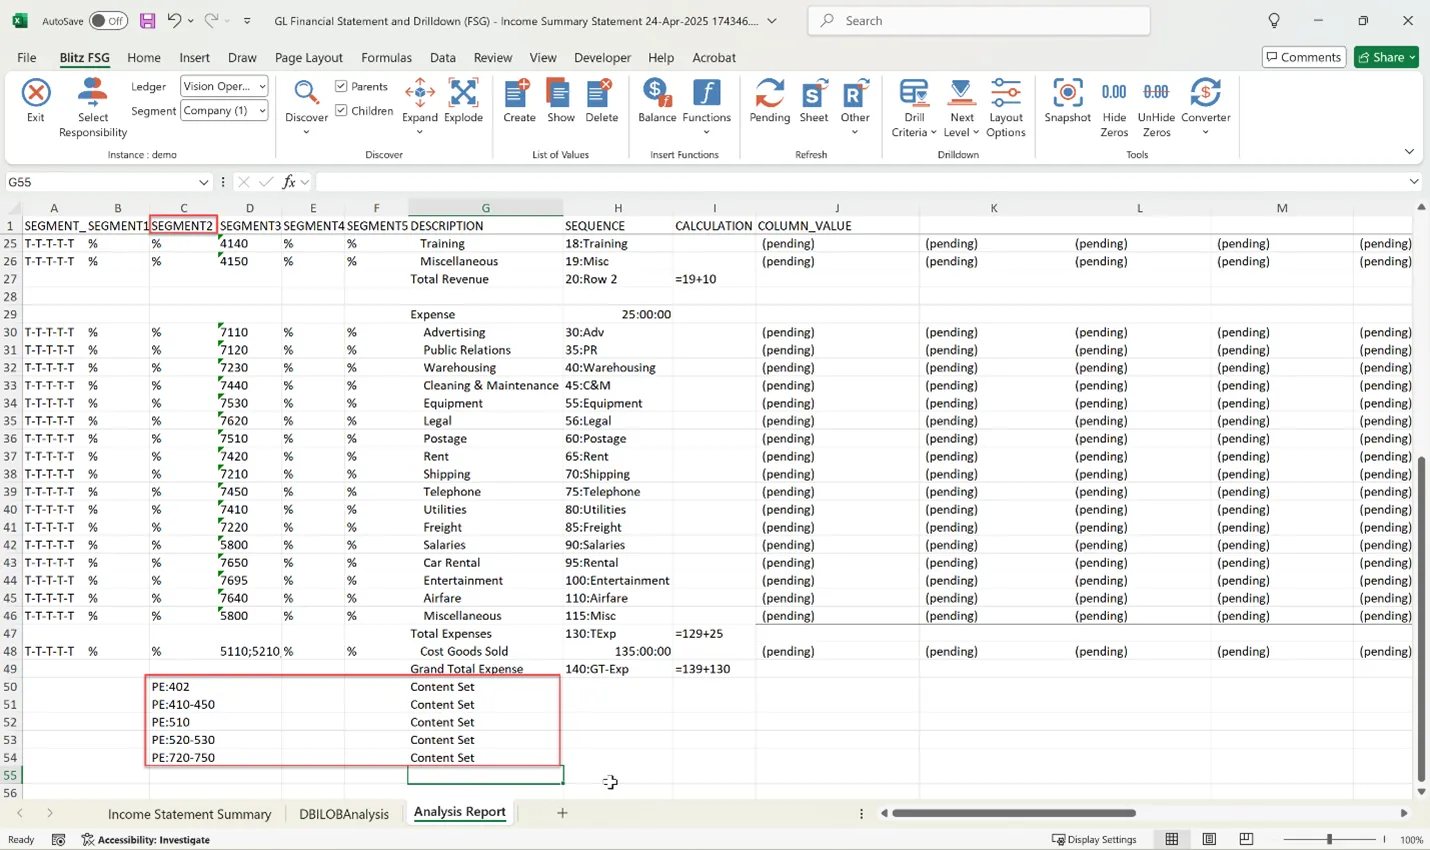
| Oracle Content Set | Converted Blitz FSG Excel Template |
| Content Set > Account Assignment | For Rows 50–54 in the example above, the template should be repeated for each populated segment (in this case, Segment2). The values should then be expanded based on the display settings assigned to the segment value which is PE in this case. |
The balance formula is prepopulated based on the defined row set and column set.
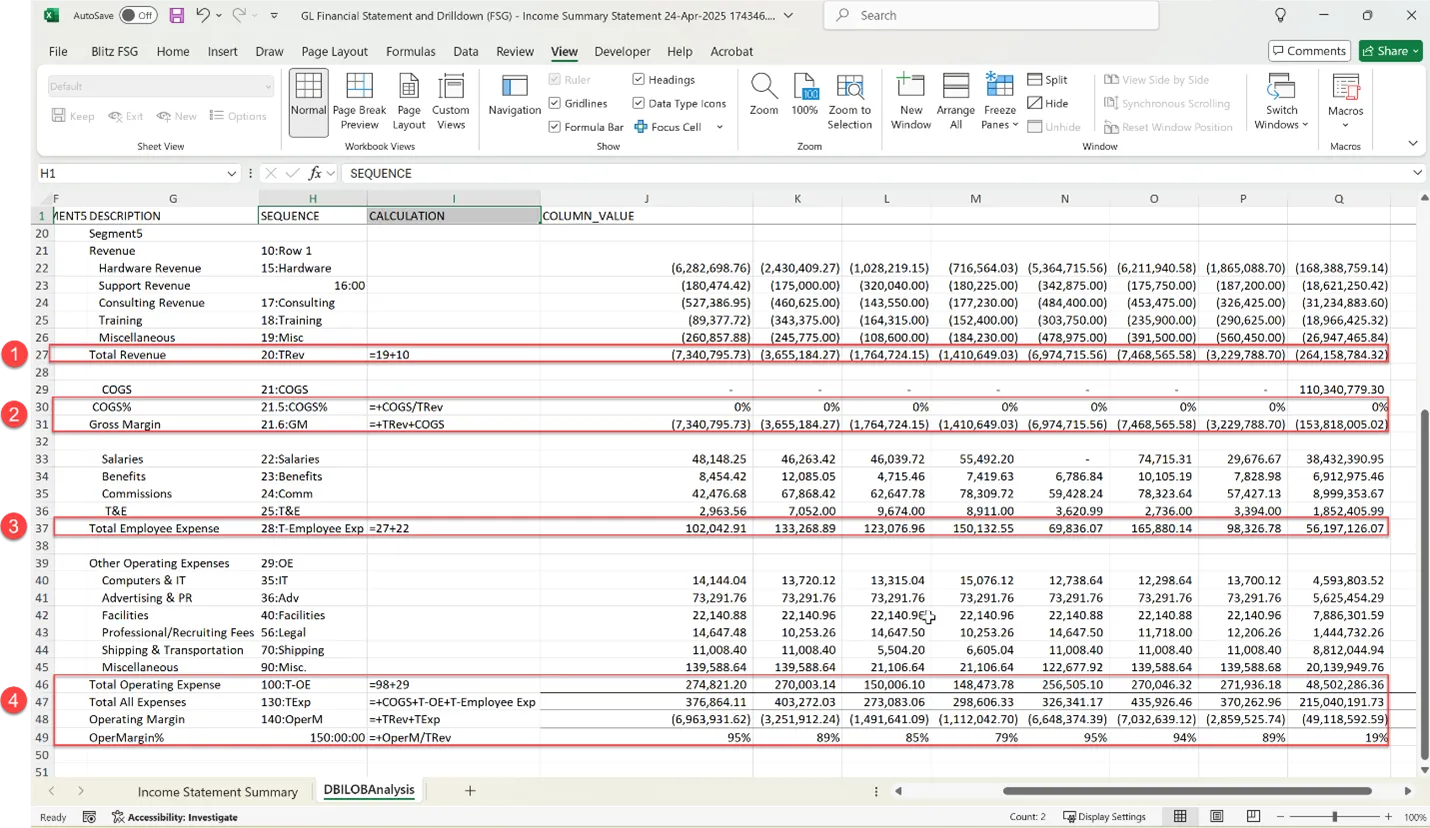
The calculations defined for the Row Set needs to done manually as shown in below example
Row.
- Row 27 Column I = +19+10 -> This indicates the row 27 should have sum of calculations of row identified between sequence 10 to 19.
- Row 30 Column I = +COGS/TRev -> This indicates the row 27 should divide the value present in the row identified with Row Name COGS with Row Name TRev.
- Row 31 Column I = +TRev+COGS -> This indicates the row 27 should add the value present in the row identified with Row Name COGS with Row Name TRev.
- Row 37 Column I = 27+22 -> This indicates the row 37 should have sum of calculations of row identified between sequence 22 to 27.
- Row 46 Column I = 98+29 -> This indicates the row 46 should add row identified by sequence 98 and 29.
- Row 47 Column I = +COGS+T-OE+T-Employee Exp -> This indicates the row 47 should add row identified by Row Name COGS, T-OE and T-Employee Exp.
- Row 48 Column I = +TRev+TExp -> This indicates the row 48 should add row identified by Row Name TRev and TExp.
- Row 49 Column I = OpenM/TExp -> This indicates the row 49 should divide the value present in the row identified with Row Name OpenM with Row Name TExp.
After completing manual adjustments using the supporting information from Oracle FSG’s Row Set, Column Set, and Content Set, delete any temporary rows and columns that were added solely for reference or template construction.
Complete any remaining modifications, then finalize your templates for future use.
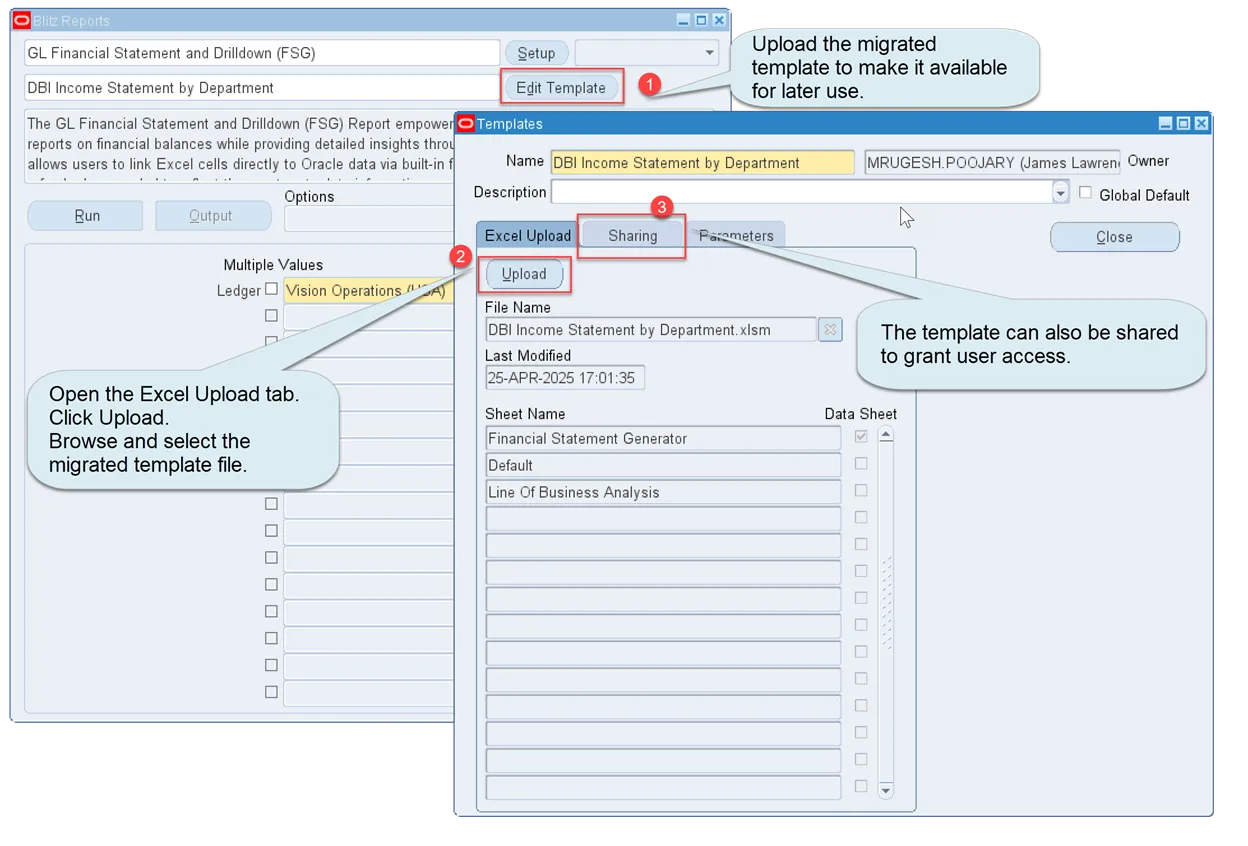
Upload the migrated template to make it available for later use.
- Open Template screen.
- Open the Excel Upload tab.
- Click Upload.
- Browse and select the migrated template file.
- The template can also be shared to grant user access.
GL Wand & Spreadsheet Server
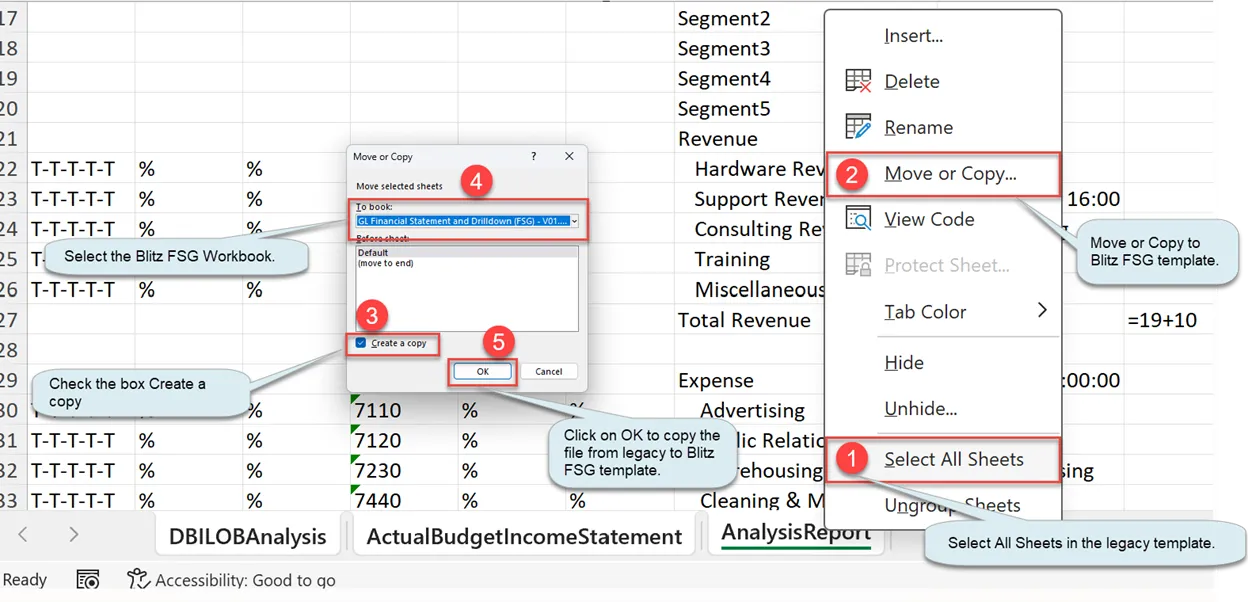
Open the workbook which has the legacy template and follow the below:
- Right Click on Sheet Name and click ‘Select All Sheets’ in the legacy template.
- Right Click on Sheet Name and click ‘Move or Copy…’
- Check the box ‘Create a copy’
- Select the Blitz FSG Workbook in the ‘To book’ list.
- Click on ‘OK’ button to copy the file from legacy to Blitz FSG Template.
After copying the legacy sheets into GL Financial Statement and Drilldown (FSG) workbook in Blitz FSG:
- Go to the Converter.
- Select the source legacy tool (GL Wand, Spreadsheet Server) to start the migration.