
2 What Blitz Report does with very large outputs
3 The Excel Data Model
4 One pivot across multiple data tabs
4.1 Format each data tab as a table
4.2 Append the tables with one Power Query
4.3 Load to the Data Model
4.4 Insert the pivot from the Data Model
4.5 Refresh on later runs
5 The alternative: aggregate in the report SQL
6 Doing it once with an uploaded template
1 Excel’s one million row limit
An Excel worksheet holds at most 1,048,576 rows. With one row taken by the column headers, that is 1,048,575 data records per sheet – a hard boundary of the file format that no reporting tool can lift.
The same boundary applies to pivot tables twice over: a pivot sourced from a worksheet range can never see more than one sheet’s rows, and the rendered pivot output is itself a worksheet, so it is capped at 1,048,576 rows including headers and grand totals.
2 What Blitz Report does with very large outputs
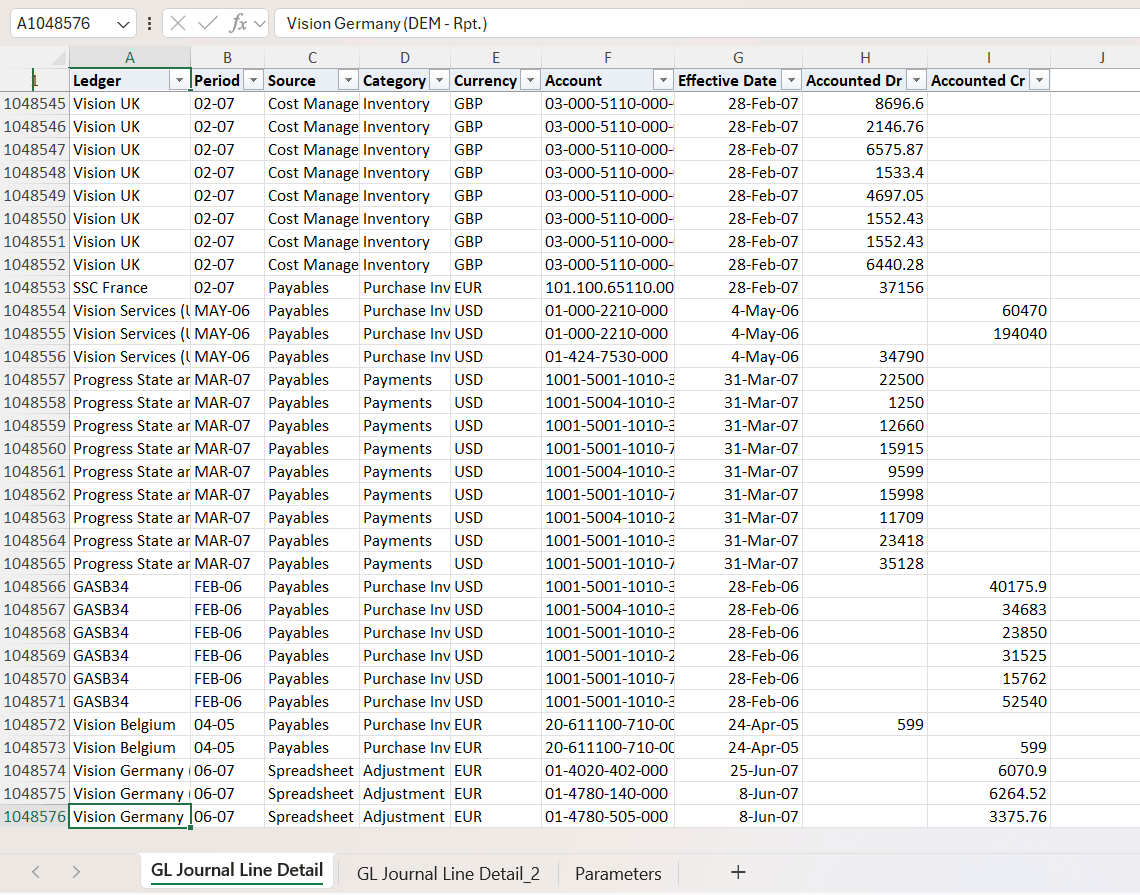
When a report extracts more records than fit on one sheet, Blitz Report continues the data on additional tabs. The screenshot below is a 1,498,329 row extract: the first tab is filled to row 1,048,576 and a second tab carries the remaining 449,754 records.
The number of extracted records is not limited by the sheet size. The Blitz Report Row Limit profile option can cap it, and Blitz Report XLSX Sheet Row Limit controls how many rows go on a sheet before the data continues on the next tab.
If the report runs with a pivot template and the data exceeds one sheet, Blitz Report extracts every record across the tabs and skips the pivot, because a worksheet range based pivot structurally cannot source more than one sheet. The concurrent request log says so explicitly:
Warning: The data is split across multiple sheets, so the pivot is skipped as a worksheet range based pivot cannot source more than one sheet. To pivot data of this size, upload an Excel template whose pivot is built on the workbook data model (Power Pivot), fed by a Power Query that combines the Excel tables of the data sheets. The data model is not limited by the worksheet row count and every additional data sheet carries a copy of the data sheet table, so the query picks the new sheets up automatically. |
Every extracted record is still in the workbook – only the pivot sheet is omitted. The rest of this post is the procedure that warning points to.
The skip is in Blitz Report 3.3.6 from the 25-Aug-2026 build onwards, with the warning worded as above in builds after 5-Sep-2026 and slightly differently before that. Builds before 25-Aug-2026 attempted the pivot regardless, and because a worksheet range covers a single sheet, the result silently summarised only part of the first tab – a pivot that looks correct but reports too little. The build date of your own installation is shown on the Parameters sheet of any Blitz Report output.
3 The Excel Data Model
The Data Model is Excel’s in-memory analytics engine, also known as Power Pivot, included in Excel for Windows since the 2013 release. Excel for Mac has no Data Model, so the procedure below is for Windows. It stores data in compressed columnar form outside the worksheet grid and is documented to hold close to 2 billion rows per table, so the sheet limit does not apply to it.
A pivot table built on the Data Model behaves like any other pivot: same field list, same layout options, same slicers. The only difference is where the data lives.
4 One pivot across multiple data tabs
Starting point: a Blitz Report output whose data spans two or more tabs.
4.1 Format each data tab as a table
On each data tab, click any data cell and press Ctrl+T, confirming “My table has headers”. On the Table Design ribbon, give the tables a common name prefix, for example Data_1 and Data_2.
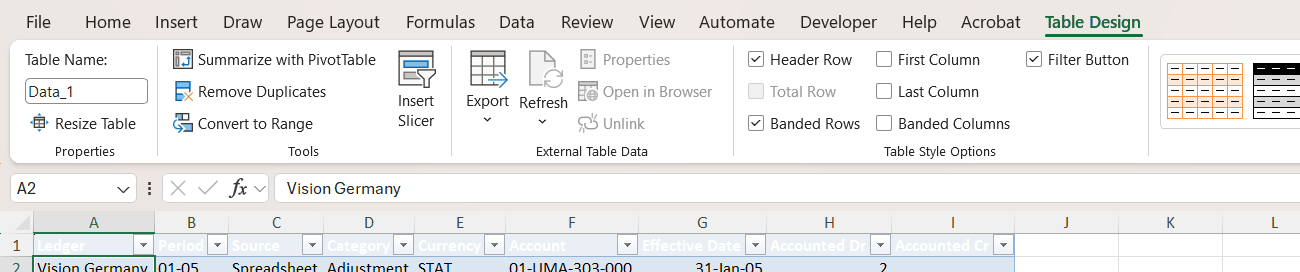
Power Query’s function for reading the current workbook enumerates tables and named ranges rather than raw sheets, so the tables are what makes the tabs visible to the query.
4.2 Append the tables with one Power Query
Data > Get Data > From Other Sources > Blank Query, open the Advanced Editor and paste:
let
    Source = Excel.CurrentWorkbook(),
    DataSheets = Table.SelectRows(Source, each Text.StartsWith([Name], "Data_")),
    Combined = Table.Combine(DataSheets[Content])
in
Combined |
The query picks up every table whose name starts with the prefix and appends them, so the same query serves a two tab and a five tab output alike.
Then set the data type of every column you intend to summarise: click its header in the query preview and pick Data Type > Decimal Number. Power Query records that as a Changed Type step, so the query itself needs no hand editing. Without it those columns reach the Data Model as text and any measure over them fails: the pivot then shows its row labels with no values, and the field list marks the table with a warning triangle. Columns you only group or filter by can be left alone.
4.3 Load to the Data Model
Close & Load To… > select “Only Create Connection” and tick “Add this data to the Data Model”. Excel imports the appended rows into the Data Model, past the sheet limit, since no worksheet is involved.
Both halves of that choice matter, and getting it wrong fails silently. If the query is loaded as a table as well – the “Table” or “Table and Data Model” option – Excel also writes the appended rows onto a worksheet, and that worksheet is subject to the very 1,048,576 row ceiling this procedure exists to escape. The load truncates there, and Excel adds a second Data Model table fed from that worksheet copy. A pivot built on that second table then reports only the rows that fit: a plausible looking grand total, short by everything past the limit, with no warning anywhere. Measured on a 1,337,383 row extract, the worksheet copy held 1,048,575 rows and the pivot understated the total by 35%. “Only Create Connection” avoids the worksheet entirely, so there is nothing to truncate and only one table in the model to pivot on.
4.4 Insert the pivot from the Data Model
Insert > PivotTable > From Data Model, and build the pivot as usual. The field list opens with an Active and an All tab. All lists every table in the workbook, so the sheet tables Data_1 and Data_2 appear there next to the query. Expand the query and drag its fields only, the text columns to Rows and the amount columns to Values. Once a field is placed, the Active tab shows just the query, which is the check that the pivot reads the Data Model. Do not drag a field from one of the sheet tables: Excel would add that table to the Data Model, and the pivot would summarise that one tab.
The entry point matters as much as the field choice. A pivot inserted with the cursor inside a data table, via Insert > PivotTable > From Table/Range, is an ordinary worksheet pivot bound to that table, even in a workbook that has a Data Model. It sees one tab only, and Excel does not refresh it when the file is opened.
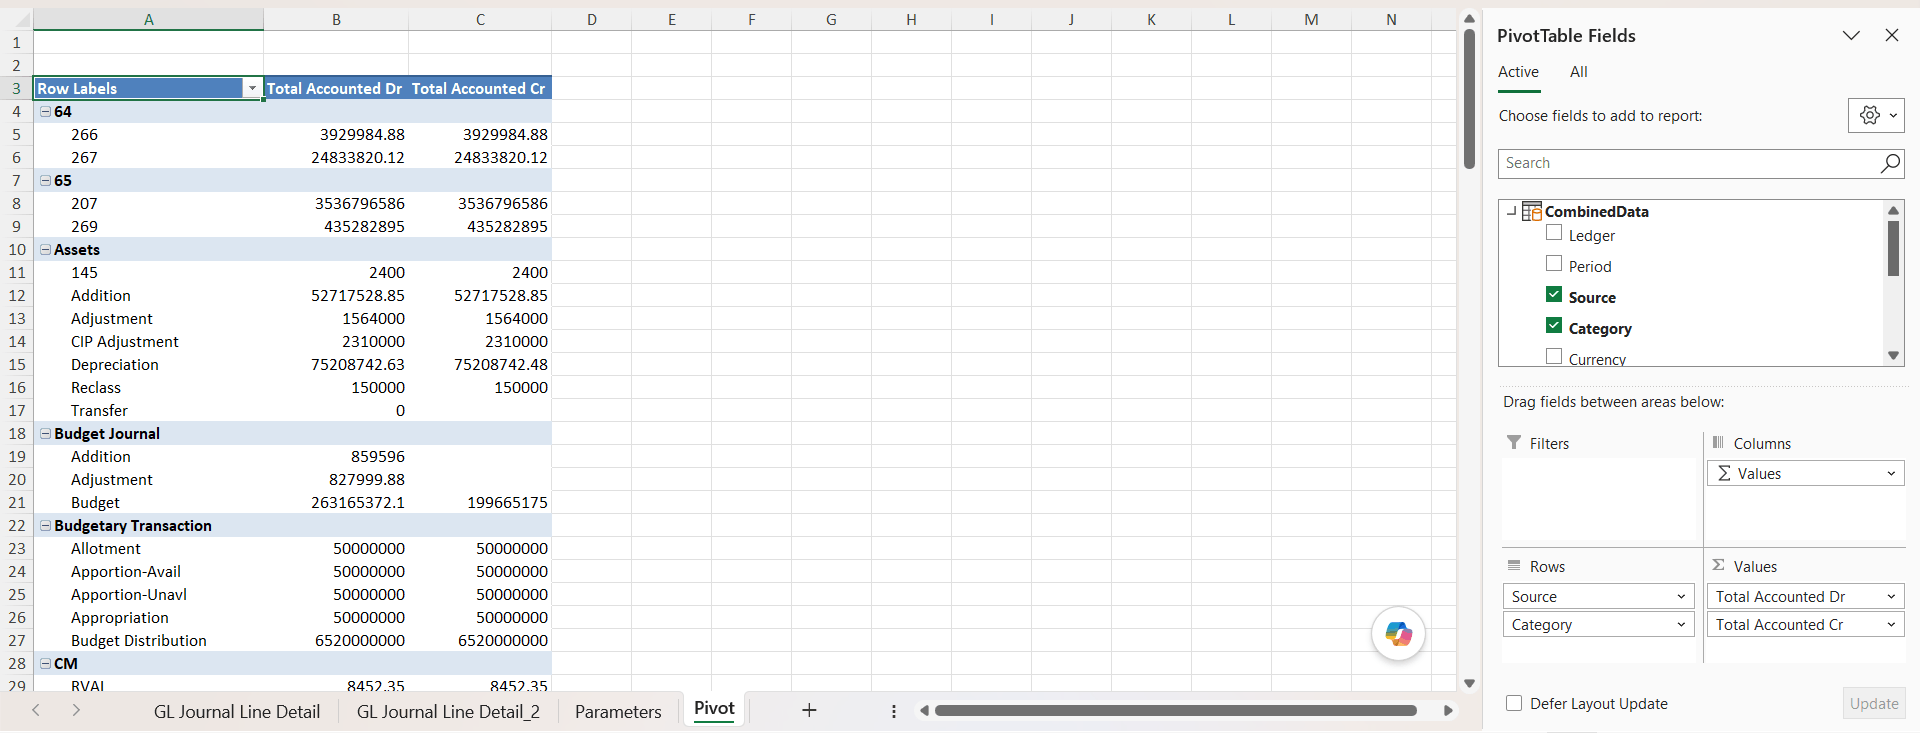
The pivot above summarises all 1,498,329 records across both tabs, and its grand totals tie back to the sum of the underlying columns. The rendered pivot is still a worksheet, so it must aggregate below 1,048,576 output rows, which an aggregating pivot naturally does.
4.5 Refresh on later runs
Data > Queries & Connections > right-click the query > Properties > tick “Refresh data when opening the file”. When the workbook is used as a template and a later run of the report is opened, the refresh rebuilds the Data Model from that run’s tabs and the pivot follows.
This step decides whether the pivot shows current numbers. The Data Model is stored inside the workbook, so a file whose query has not been refreshed opens showing the numbers that were in the model when the template was saved, not the data sitting on its own tabs. The pivot renders those saved numbers without any indication that they are stale, and the extract itself is complete and correct all the while. With the box ticked the flag travels with the template, so every generated run refreshes itself on open. Blitz Report builds after 5-Sep-2026 also set it on every generated file themselves, as section 6 describes, so on those builds the tick is a safeguard rather than a requirement. A recipient who opens the file in Protected View, or declines the data connection prompt, can refresh it manually with Data > Refresh All.
5 The alternative: aggregate in the report SQL
Often the most practical answer needs no Data Model at all. A pivot over 1.5 million detail rows is performing an aggregation the database can do first, and a summary version of the report that groups the SQL to the pivot’s own dimensions collapses the extract far below the sheet limit. A normal Blitz Report pivot template then works directly, and the output file is a fraction of the size.
6 Doing it once with an uploaded template
Blitz Report’s Excel template upload feature already maintains Data Model based templates: when a report runs with an uploaded template whose pivot is built on the Data Model, the generated file rebuilds itself from the extracted data. In Blitz Report 3.3.6 builds after 5-Sep-2026 this also holds when the extract overflows one sheet: each additional tab is created as an Excel table named after the template’s own data table, Table1_2, Table1_3 and so on, so a query written as in 4.2 with that table’s name as the prefix picks the new tabs up with no manual step, and the whole procedure above reduces to building the template once. Refresh on open is set on the generated file automatically, so the pivot rebuilds itself from the new tabs rather than showing the numbers the template was saved with.
Two things in the template must be right, and both fail silently when they are not. The query must be loaded with Only Create Connection and Add this data to the Data Model, as in 4.3. And the pivot must be inserted From Data Model on the query’s table, as in 4.4, never from the data table itself: a pivot built from the table is bound to that one tab and is not refreshed on open, so the generated file shows the numbers the template was saved with. That is the symptom to recognise. A pivot showing stale or partial totals over a complete extract means it reads the sheet table rather than the query.
If you would like help setting this up on one of your own reports, please contact us.